Title
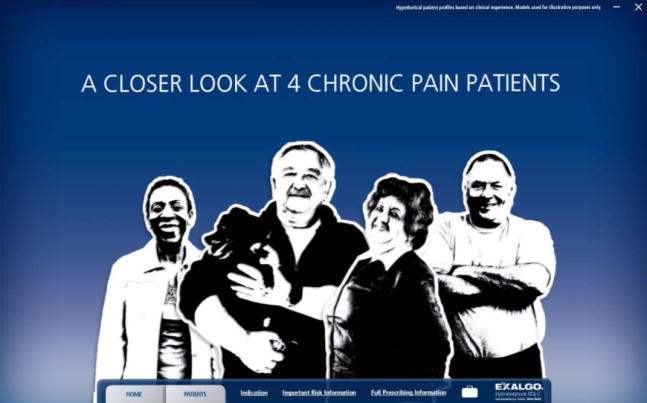
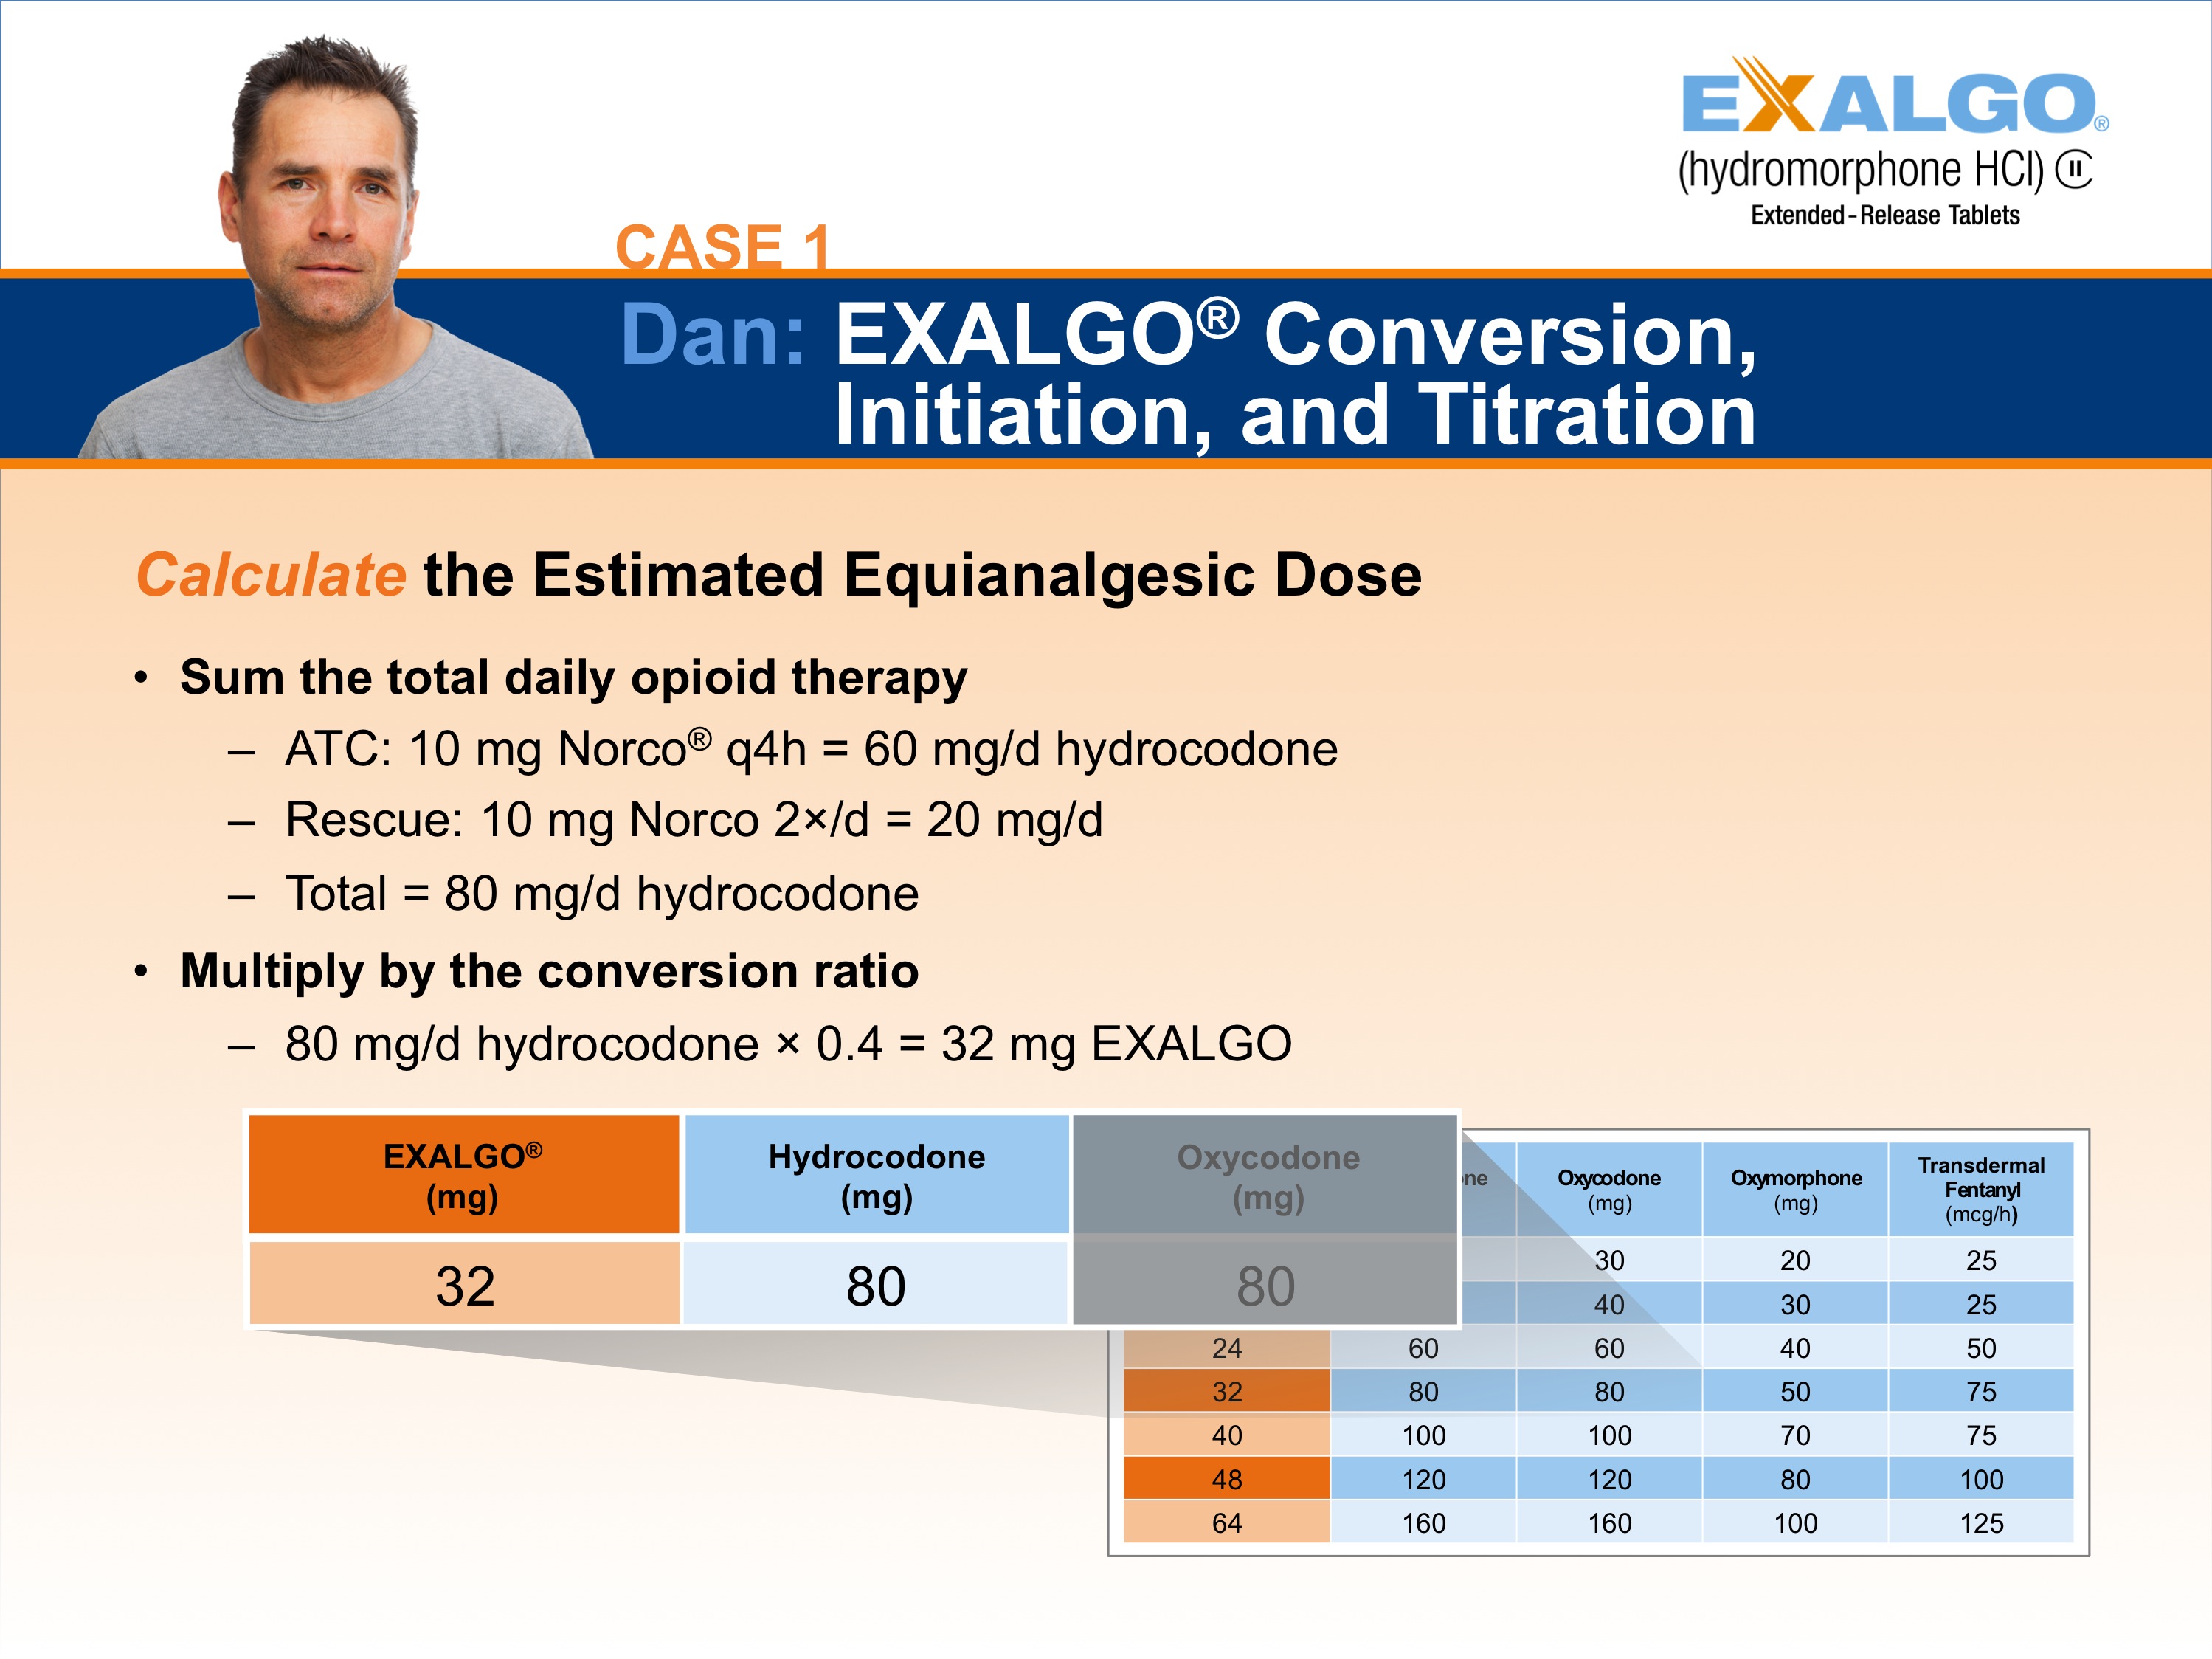
A slide from a presentation titled "Case 1: Dan: EXALGO Conversion Initiation and Titration". The slide has a blue background with a photo of Dan on the top left corner. Below the photo there is a table with three columns. The first column is titled "Calculate the Estimated Equianalgesic Dose" and the second column is labeled "Sum the total daily opioid therapy".
The table has three rows and three columns each representing a different type of hydrocodone. The columns are labeled "ATC" "10 mg Norco" and "20 mg/dL". The table also has a table that shows the conversion ratio of each type of medication.
At the bottom of the slide there are two columns - "Exalgo" and "Hydrocodone". The first row shows the number of doses in each dose while the second row shows that the doses are in total. The table is divided into two columns with the first column showing the total dosage of the medication and the third column displaying the conversion rate. The second column shows the percentage of doses for each medication with each dose having a different dosage. The third column shows a percentage of the total doses with a total of 30 doses.
Category
Source 1 of 4
-
Date
2012
Collection
-
Date
2012
Collection
-
Date
2012
Collection
-
Date
2012
Collection
We encourage you to view the image in the context of its source document(s) and cite the source(s) when using these images. However, to cite just this image alone, click the “Cite This Image” button and then paste the copied text.
