Title
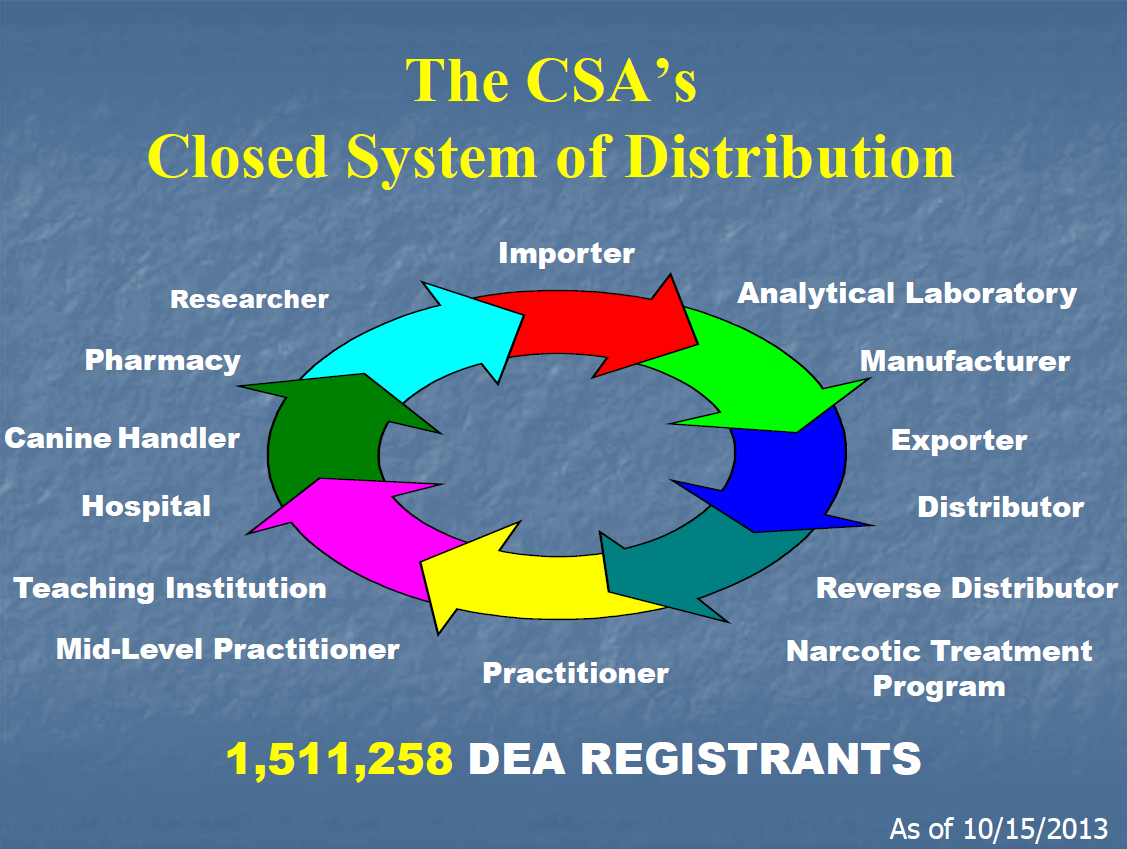
A circular diagram that represents the closed system of distribution of the CSA's. The diagram is divided into six sections each representing a different component of the system.
The first section is labeled "Research" the second section is titled "Importer" the third section is labeled "Analytical Laboratory" the fourth section is numbered "Manufacturer" and the fifth section is named "Exporter".
Each section is represented by a different color. The red section represents the researcher the blue section represents pharmacy the green section represents canine handler the yellow section represents hospital the orange section represents teaching institution the middle-level practitioner the pink section represents practitioner and the purple section represents narcotic treatment program. The chart also includes the number of DEA registrants in each section as of 10/15/2013.
Type
Source 1 of 36
-
Date
2014
Collection
-
Date
2016
Collection
-
Date
2012
Collection
-
Date
2014
Collection
-
Date
2015
Collection
-
Date
2016
Collection
-
Date
2016
Collection
-
Date
2016
Collection
-
Date
2014
Collection
-
Date
2014
Collection
-
Date
2014
Collection
-
Date
2015
Collection
-
Date
2014
Collection
-
Date
2014
Collection
-
Date
2016
Collection
-
Date
2014
Collection
-
Date
2014
Collection
-
Date
2014
Collection
-
Date
2015
Collection
-
Date
2014
Collection
-
Date
2014
Collection
-
Date
2015
Collection
-
Date
2016
Collection
-
Date
2017
Collection
-
Date
2016
Collection
-
Date
2017
Collection
-
Date
2014
Collection
-
Date
2015
Collection
-
Date
2014
Collection
-
Date
2014
Collection
-
Date
2014
Collection
-
Date
2016
Collection
-
Date
2015
Collection
-
Date
2014
Collection
-
Date
2016
Collection
-
Date
2014
Collection
We encourage you to view the image in the context of its source document(s) and cite the source(s) when using these images. However, to cite just this image alone, click the “Cite This Image” button and then paste the copied text.
