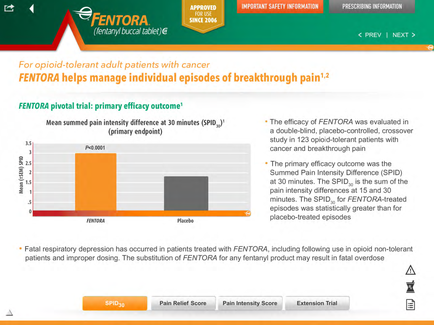
A screenshot of the mentor website which provides information about the treatment of opioid-tolerant adult patients with cancer. The website has a green and orange color scheme with the logo of the company at the top. On the left side of the image there is a bar graph that shows the percentage of patients who have been diagnosed with FENTOTA which is a type of chronic pain disorder. The graph is divided into two sections one in orange and the other in gray. The orange section shows that the majority of patients have been affected by the treatment while the gray section shows a decrease in the number of patients affected. The graph also includes a legend that explains the meaning of the orange section. The text on the image explains that the treatment was evaluated in a double-blind placebo-controlled cross-crossover study in the study of the primary efficacy outcome of the treatment. The chart also mentions that the study was conducted by the FDA (mentor) and that it was conducted to assess the effectiveness of the study. - The text below the graph explains that FENTORTA helps manage individual episodes of breakthrough pain 1.2. The image also mentions the importance of the safety information section which includes information about prescription information and the extension trial.
Description 
Type
Category
Source 1 of 4
-
Date
2014
Collection
-
Date
2014
Collection
-
Date
2014
Collection
-
Date
2014
Collection
We encourage you to view the image in the context of its source document(s) and cite the source(s) when using these images. However, to cite just this image alone, click the “Cite This Image” button and then paste the copied text.