


Title
Description 
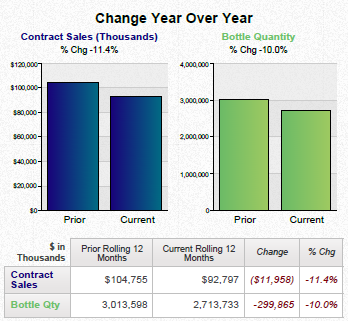
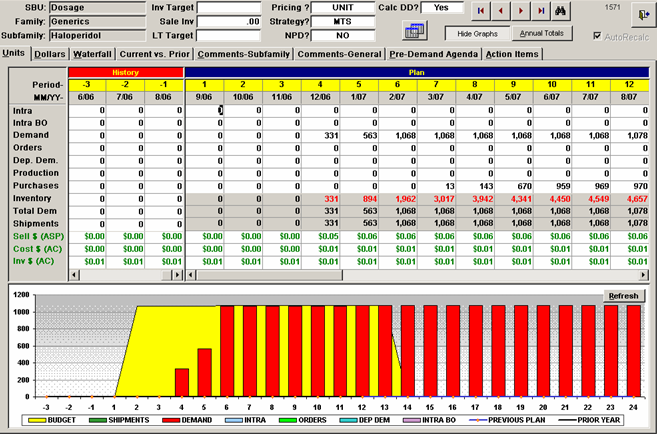
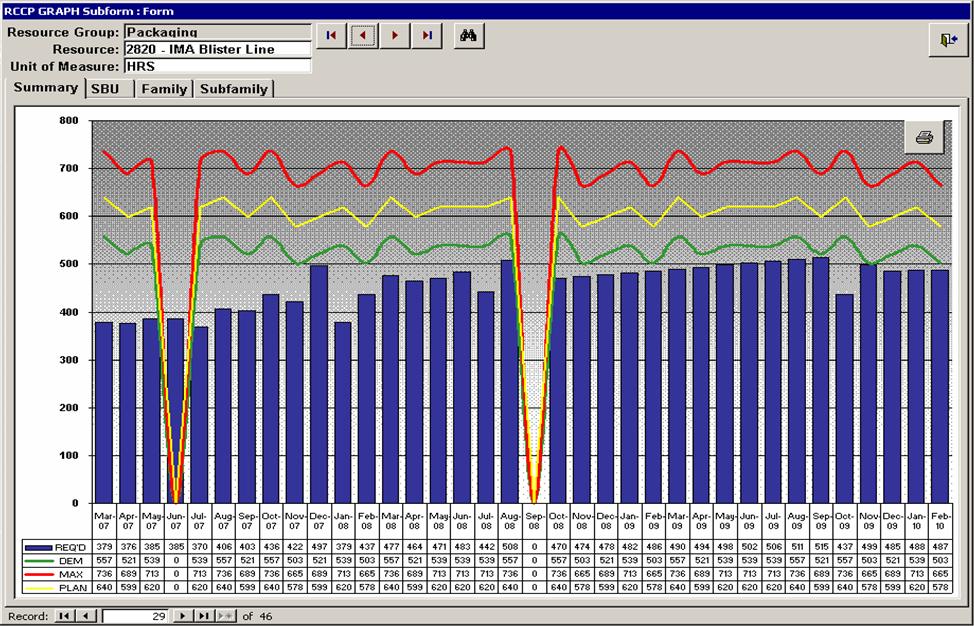
A screenshot of a data graph in a software interface. The graph is divided into two sections - the top section is a line graph and the bottom section is an x-axis. The x-y axis represents the number of people who have been diagnosed with cancer while the y-axis shows the percentage of people with cancer.
There are lines of various colors in the graph. The red line represents the change in the percentage with the blue line representing the percentage. The green line shows a percentage decrease. There is also a yellow line on the graph. The lines are plotted on a white background and there is a title at the top of the graph that reads "Resource Group: Packaging Line". Below the title there are several buttons and options for the user to navigate through the data graph such as "Summary" "Family" and "Subfamily".
Type
Category
-
Date
2007
Collection
We encourage you to view the image in the context of its source document(s) and cite the source(s) when using these images. However, to cite just this image alone, click the “Cite This Image” button and then paste the copied text.