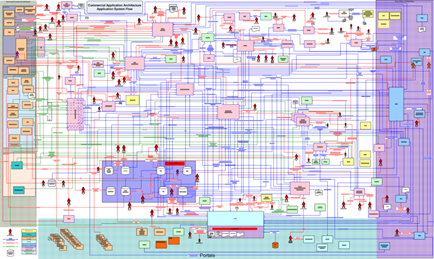
A flowchart or diagram that appears to be a visual representation of a computer system. It is divided into multiple sections each representing a different component of the system. The top section of the flowchart has a blue background with multiple lines and dots representing different components. The lines are arranged in a grid-like pattern with each component represented by a different color. The colors range from light blue to dark blue with some areas being red orange yellow green and purple. There are also several icons scattered throughout the chart such as a computer monitor a keyboard and a mouse which could represent different types of data or information. The chart also has a title at the top that reads "Flowchart" and a subtitle at the bottom that explains the purpose of each component and how they interact with each other. The overall design of the chart is simple and modern with a focus on the different components and their connections.
Description 
Type
Category
Source 1 of 7
-
Date
2016
Collection
-
Date
2015
Collection
-
Date
2016
Collection
-
Date
2016
Collection
-
Date
2016
Collection
-
Date
2016
Collection
-
Date
2016
Collection
We encourage you to view the image in the context of its source document(s) and cite the source(s) when using these images. However, to cite just this image alone, click the “Cite This Image” button and then paste the copied text.