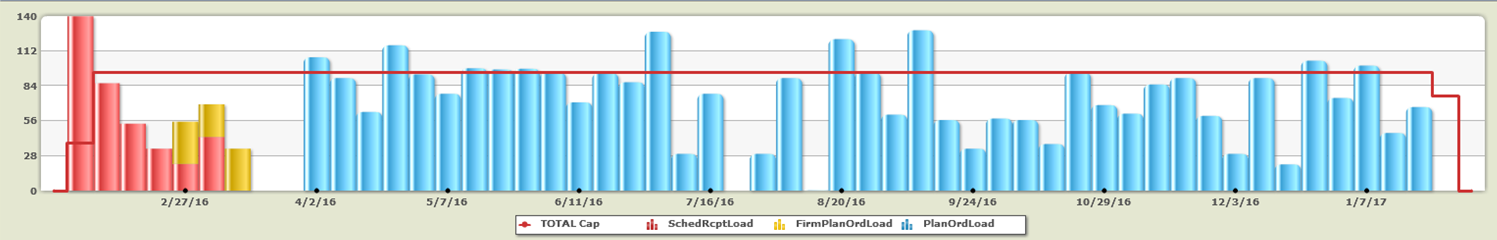
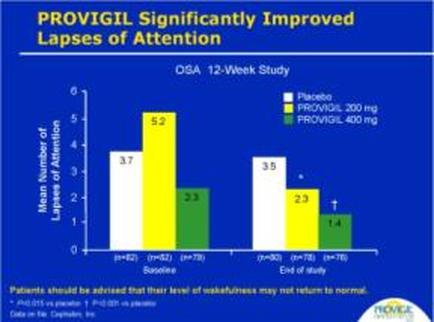
OIDA Image Collection
Filters:
Reset 
A bar graph that shows the percentage of patients who should be advised that their level of wakefulness may not return to normal. The x-axis of the graph is labeled "prodigal Significantly Improved Lapses of Attention" and the y-axis is labeled as "OSA 12-Week Study". There are four bars in the graph each representing a different level of attention. The first bar is yellow the second is green the third is orange and the fourth is yellow. The bars are arranged in a vertical line with the highest bar at the top and the lowest at the bottom. The first bar on the left shows that the majority of the patients should be aware that their levels of attention may not be affected by the presence of prodigal which is a type of medication used to treat wakefulness. The second bar shows that there is a significant increase in the number of lapses of attention with a slight decrease in the duration of the study. The third bar shows a slight increase in those lapses with an increase of around 1.4%. Overall the graph shows that prodigal is significantly improved in the study as indicated by the text on the top of the image.

Description Generated using AI

A bar graph that shows the percentage of patients who should be advised that their level of wakefulness may not return to normal. The x-axis of the graph is labeled "prodigal Significantly Improved Lapses of Attention" and the y-axis is labeled as "OSA 12-Week Study". There are four bars in the graph each representing a different level of attention. The first bar is yellow the second is green the third is orange and the fourth is yellow. The bars are arranged in a vertical line with the highest bar at the top and the lowest at the bottom. The first bar on the left shows that the majority of the patients should be aware that their levels of attention may not be affected by the presence of prodigal which is a type of medication used to treat wakefulness. The second bar shows that there is a significant increase in the number of lapses of attention with a slight decrease in the duration of the study. The third bar shows a slight increase in those lapses with an increase of around 1.4%. Overall the graph shows that prodigal is significantly improved in the study as indicated by the text on the top of the image.

We encourage you to view the image in the context of its source document(s) and cite the source(s) when using these images. However, to cite just this image alone, click the “Cite This Image” button and then paste the copied text.

Information copied to your clipboard:

"A bar graph that shows the percentage of patients who should be advised that their level of wakefulness may not return to normal. The x-axis of the g...