Title
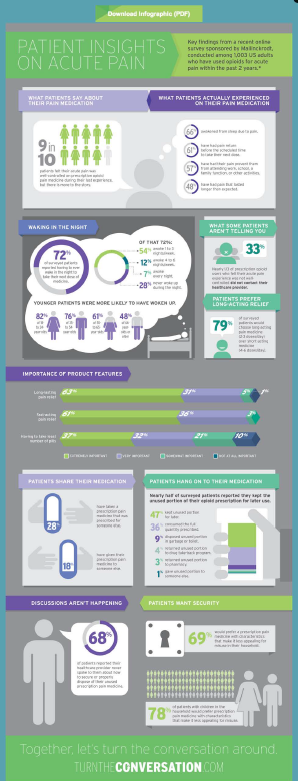
A pie chart that shows the percentage of patients experiencing pain in the patient experience of care in the Lake Superior Quality Innovation Network during FY 2016 and FY 2017.
The FY 2016 section shows that 25% of patients experienced pain while the FY 2017 section shows 25% experienced pain. The pie chart also shows that 20% experienced a clinical process of care with 25% having a clinical experience of the same type of care and 20% having an effective outcome. The background of the image is blurred but it appears to be a hospital room with a patient lying on a bed and a medical equipment. The text on the image reads "Patient Experience and Value-Based Purchasing".
Type
-
Date
2017
Collection
We encourage you to view the image in the context of its source document(s) and cite the source(s) when using these images. However, to cite just this image alone, click the “Cite This Image” button and then paste the copied text.
