Title
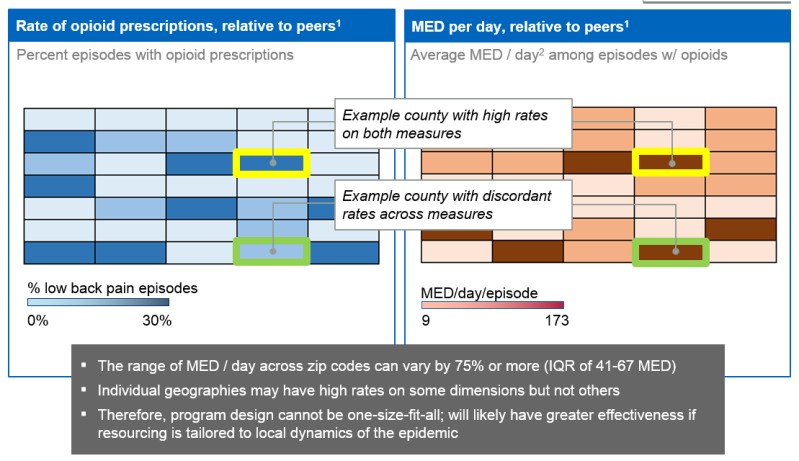
Two data visualizations recording "Rate of opioid prescriptions relative to peers" and "MED per day relative to peers". There are conclusions beneath : "The range of MED / day across zip codes can vary by 75% or more (IQR of 41-67 MED)" -- "Individual geographies may have high rates of some dimensions but not others" -- "Therefore program design cannot be one-size-fits-all will likely have greater effectiveness if resourcing is tailored to local dynamics of the epidemic.
Category
-
Date
2017
Collection
We encourage you to view the image in the context of its source document(s) and cite the source(s) when using these images. However, to cite just this image alone, click the “Cite This Image” button and then paste the copied text.


