


Title
Description
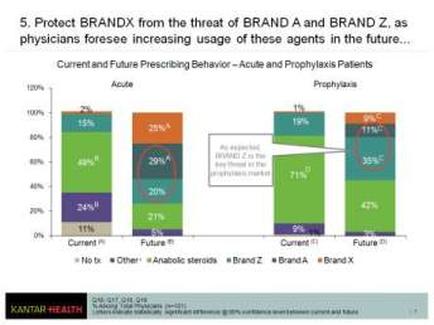
This is two bar charts comparing the Current and future prescribing behavior for Acute and Prophylaxis patients. It believes that Brand X could go from 0% of the market for Acute patient currently to 25% of the market for Acute patients in the future and that Brand X could go from 0% of the market for Prophylaxis patient currently to 9% of the market for Prophylaxis patients in the future. In both cases it is predicted that anabolic steroids will be prescribed significantly less in the future offering opportunities for all Brands (including Brand X) to potentially grow their market share.
Type 
Category
-
Date
2014
Collection
We encourage you to view the image in the context of its source document(s) and cite the source(s) when using these images. However, to cite just this image alone, click the “Cite This Image” button and then paste the copied text.