


Title
Description
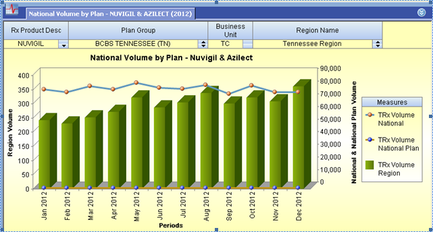
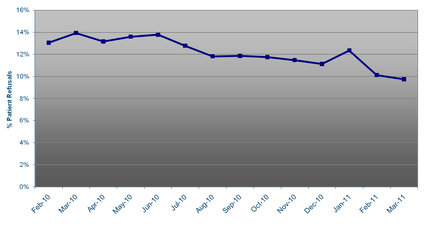
This is a run chart showing TRx for Nuvigil in the BCBS Tennessee plan group in the TC business unit in the Tennessee region for January 2012-December 2012. It includes values for TRx Volume Region (the green bars) and TRx Volume National (the orange dots connected by blue lines). TRx Volume Region is trending up while TRx Volume National experiences smaller fluctuations.
Type 
Category
-
Date
2014
Collection
We encourage you to view the image in the context of its source document(s) and cite the source(s) when using these images. However, to cite just this image alone, click the “Cite This Image” button and then paste the copied text.


![This is an infographic consisting of 6 boxes : Measures of Multiple Concepts (Include Symptoms and Impacts) [Measures of] Physical Function / Abilities Measures of Pain Measures of Fatigue Measures of Health Status and Measures of Sleep. There are between 1-7 examples listed within each box. For example the DePaul Symptom Questionnaire (DSQ) is one (of 4) Measures of Multiple Concepts. <br />](https://oida-resources-images.azureedge.net/public/full/ea27e5f5-b0fe-4f8e-9ac4-756ccacfd70b.jpeg)