


Title
Description 
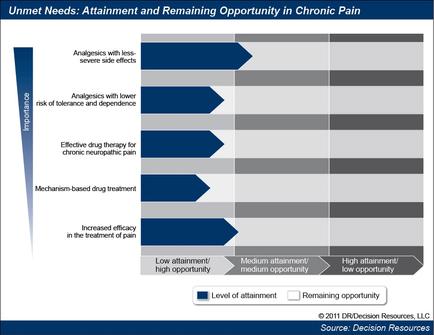
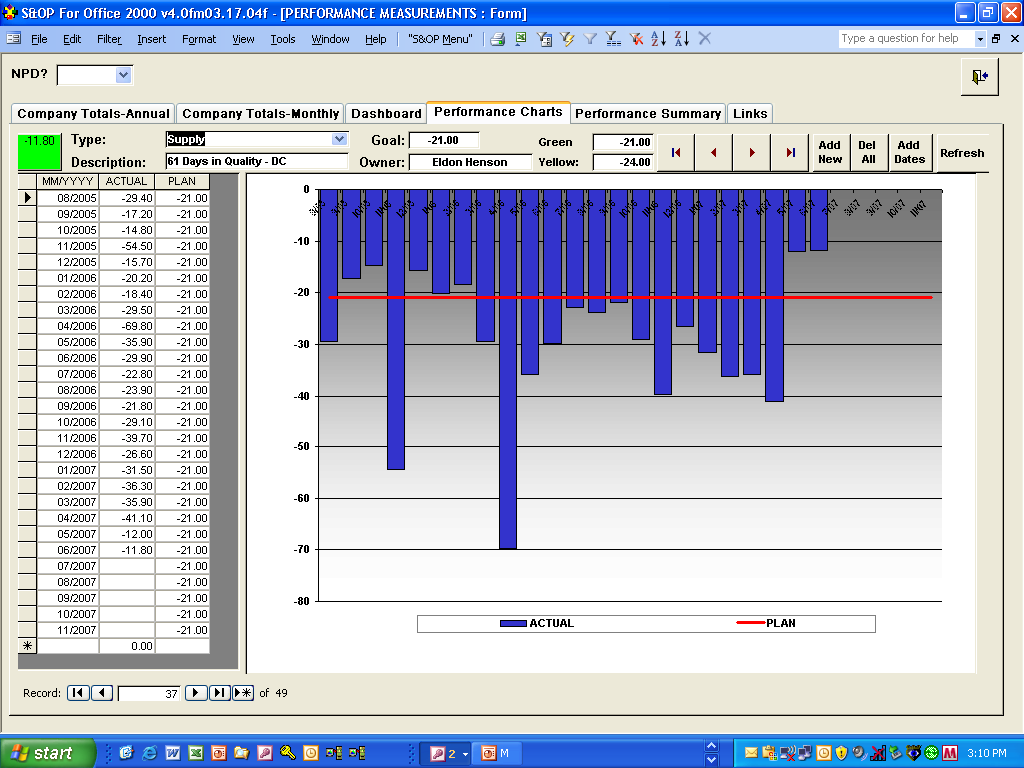
A screenshot of a performance measurement software. It shows a bar graph with multiple bars representing different performance metrics. The labels for the x-axis are unclear. The y-axis shows a range of numbers between 0 and -80. A table of data showing month and year actual and plan values is on the left side of the screen.
Type
Category
Source 1 of 2
-
Date
2004
Collection
-
Date
2007
Collection
We encourage you to view the image in the context of its source document(s) and cite the source(s) when using these images. However, to cite just this image alone, click the “Cite This Image” button and then paste the copied text.