


Title
Description
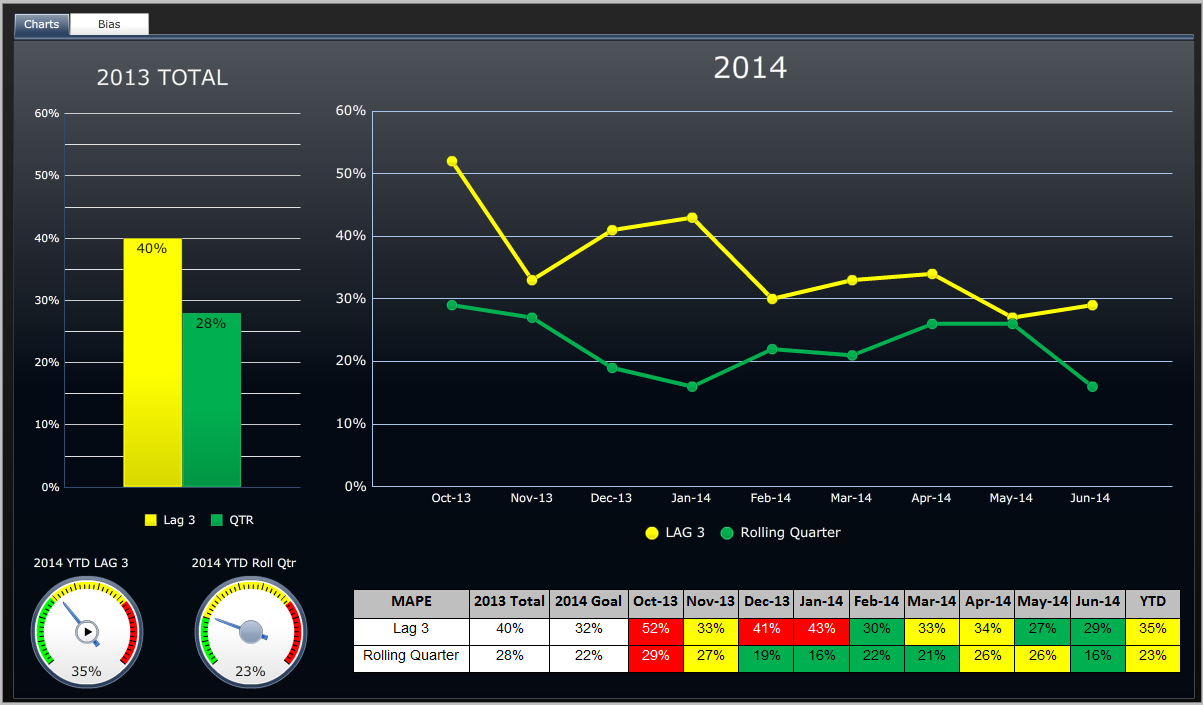
A dashboard. The left side of the dashboard shows a bar graph labeled "2013 Total" with two bars showing values of 40% for Lag 3 and 28% for QTR. Below the bar graph there are two gauges. One is labeled "2014 YTD LAG 3" which shows 35% and the other is "2014 YTD Roll Qtr" which shows 23%. Both gauges go from green to yellow to red and have an arrow pointing at where the green meets the yellow.
On the right side of the page there is a line graph labeled "2014". The x-axis shows dates between October 2013 and June 2014. The y-axis shows values between 0% and 60%. There are two lines that represent LAG 3 and Rolling Quarter. There is a table underneath that has the supporting values for the table.
Type 
Category
-
Date
2014
Collection
We encourage you to view the image in the context of its source document(s) and cite the source(s) when using these images. However, to cite just this image alone, click the “Cite This Image” button and then paste the copied text.


![A bar graph that shows the results of a study about EXALGO. The graph is divided into three sections.<br /><br />The first section is titled "Studies show switching to EXALGO could provide long lasting analgesia" and shows that in its 12-week pivotal trial EXALGO reduced pain intensity at study endpoint and throughout the trial. The second section is labeled "Conversion/Treatment Phase" and has a blue arrow pointing to the left side of the graph. The third section is labeled "6.4 Week 1 [etc.]"](https://oidaresourcesimages-cdn-endpoint-duhwc2gse6gdbng7.a01.azurefd.net/public/full/20a0a652-bcb7-4362-871c-1be2d99a256b.jpeg)