


Title
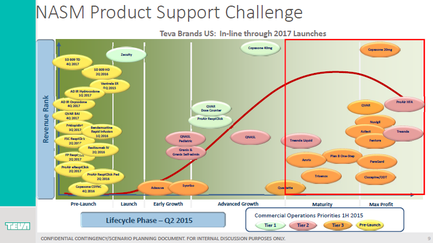
NASM product support challenge : Teva Brands US (in-line through 2017 launches)
Description
This is a data visualization showing how where various Teva products are in their Life cycle (on the x-axis) and their Revenue rank (on the y-axis). Each oval represents a single product which is also color-coded (to reflect Commercial Operations Priorities during 2015 Quarter 1). There is a significant concentraction of Pre-launch products at every Revenue rank with other products being spread more evenly throughout.
Type 
Category
-
Date
2017
Collection
We encourage you to view the image in the context of its source document(s) and cite the source(s) when using these images. However, to cite just this image alone, click the “Cite This Image” button and then paste the copied text.