


Title
Description
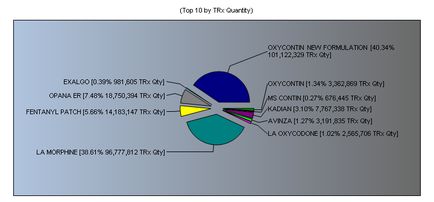
This is a pie chart showing the TRx quantity (both as a number and as a percentage) for the 10 highest-selling opioid drugs over an unspecified time period. It includes values for Oxycontin (new formulation) (40.34%) LA (Long-acting) morphine (38.61%) and 8 other drugs (Opana ER Fentanyl patch Kadian Oxycontin Avinza LA (Long-acting) oxycodone Exalgo and MS Contin).
Type 
Category
-
Date
2011
Collection
We encourage you to view the image in the context of its source document(s) and cite the source(s) when using these images. However, to cite just this image alone, click the “Cite This Image” button and then paste the copied text.