


Title
Description
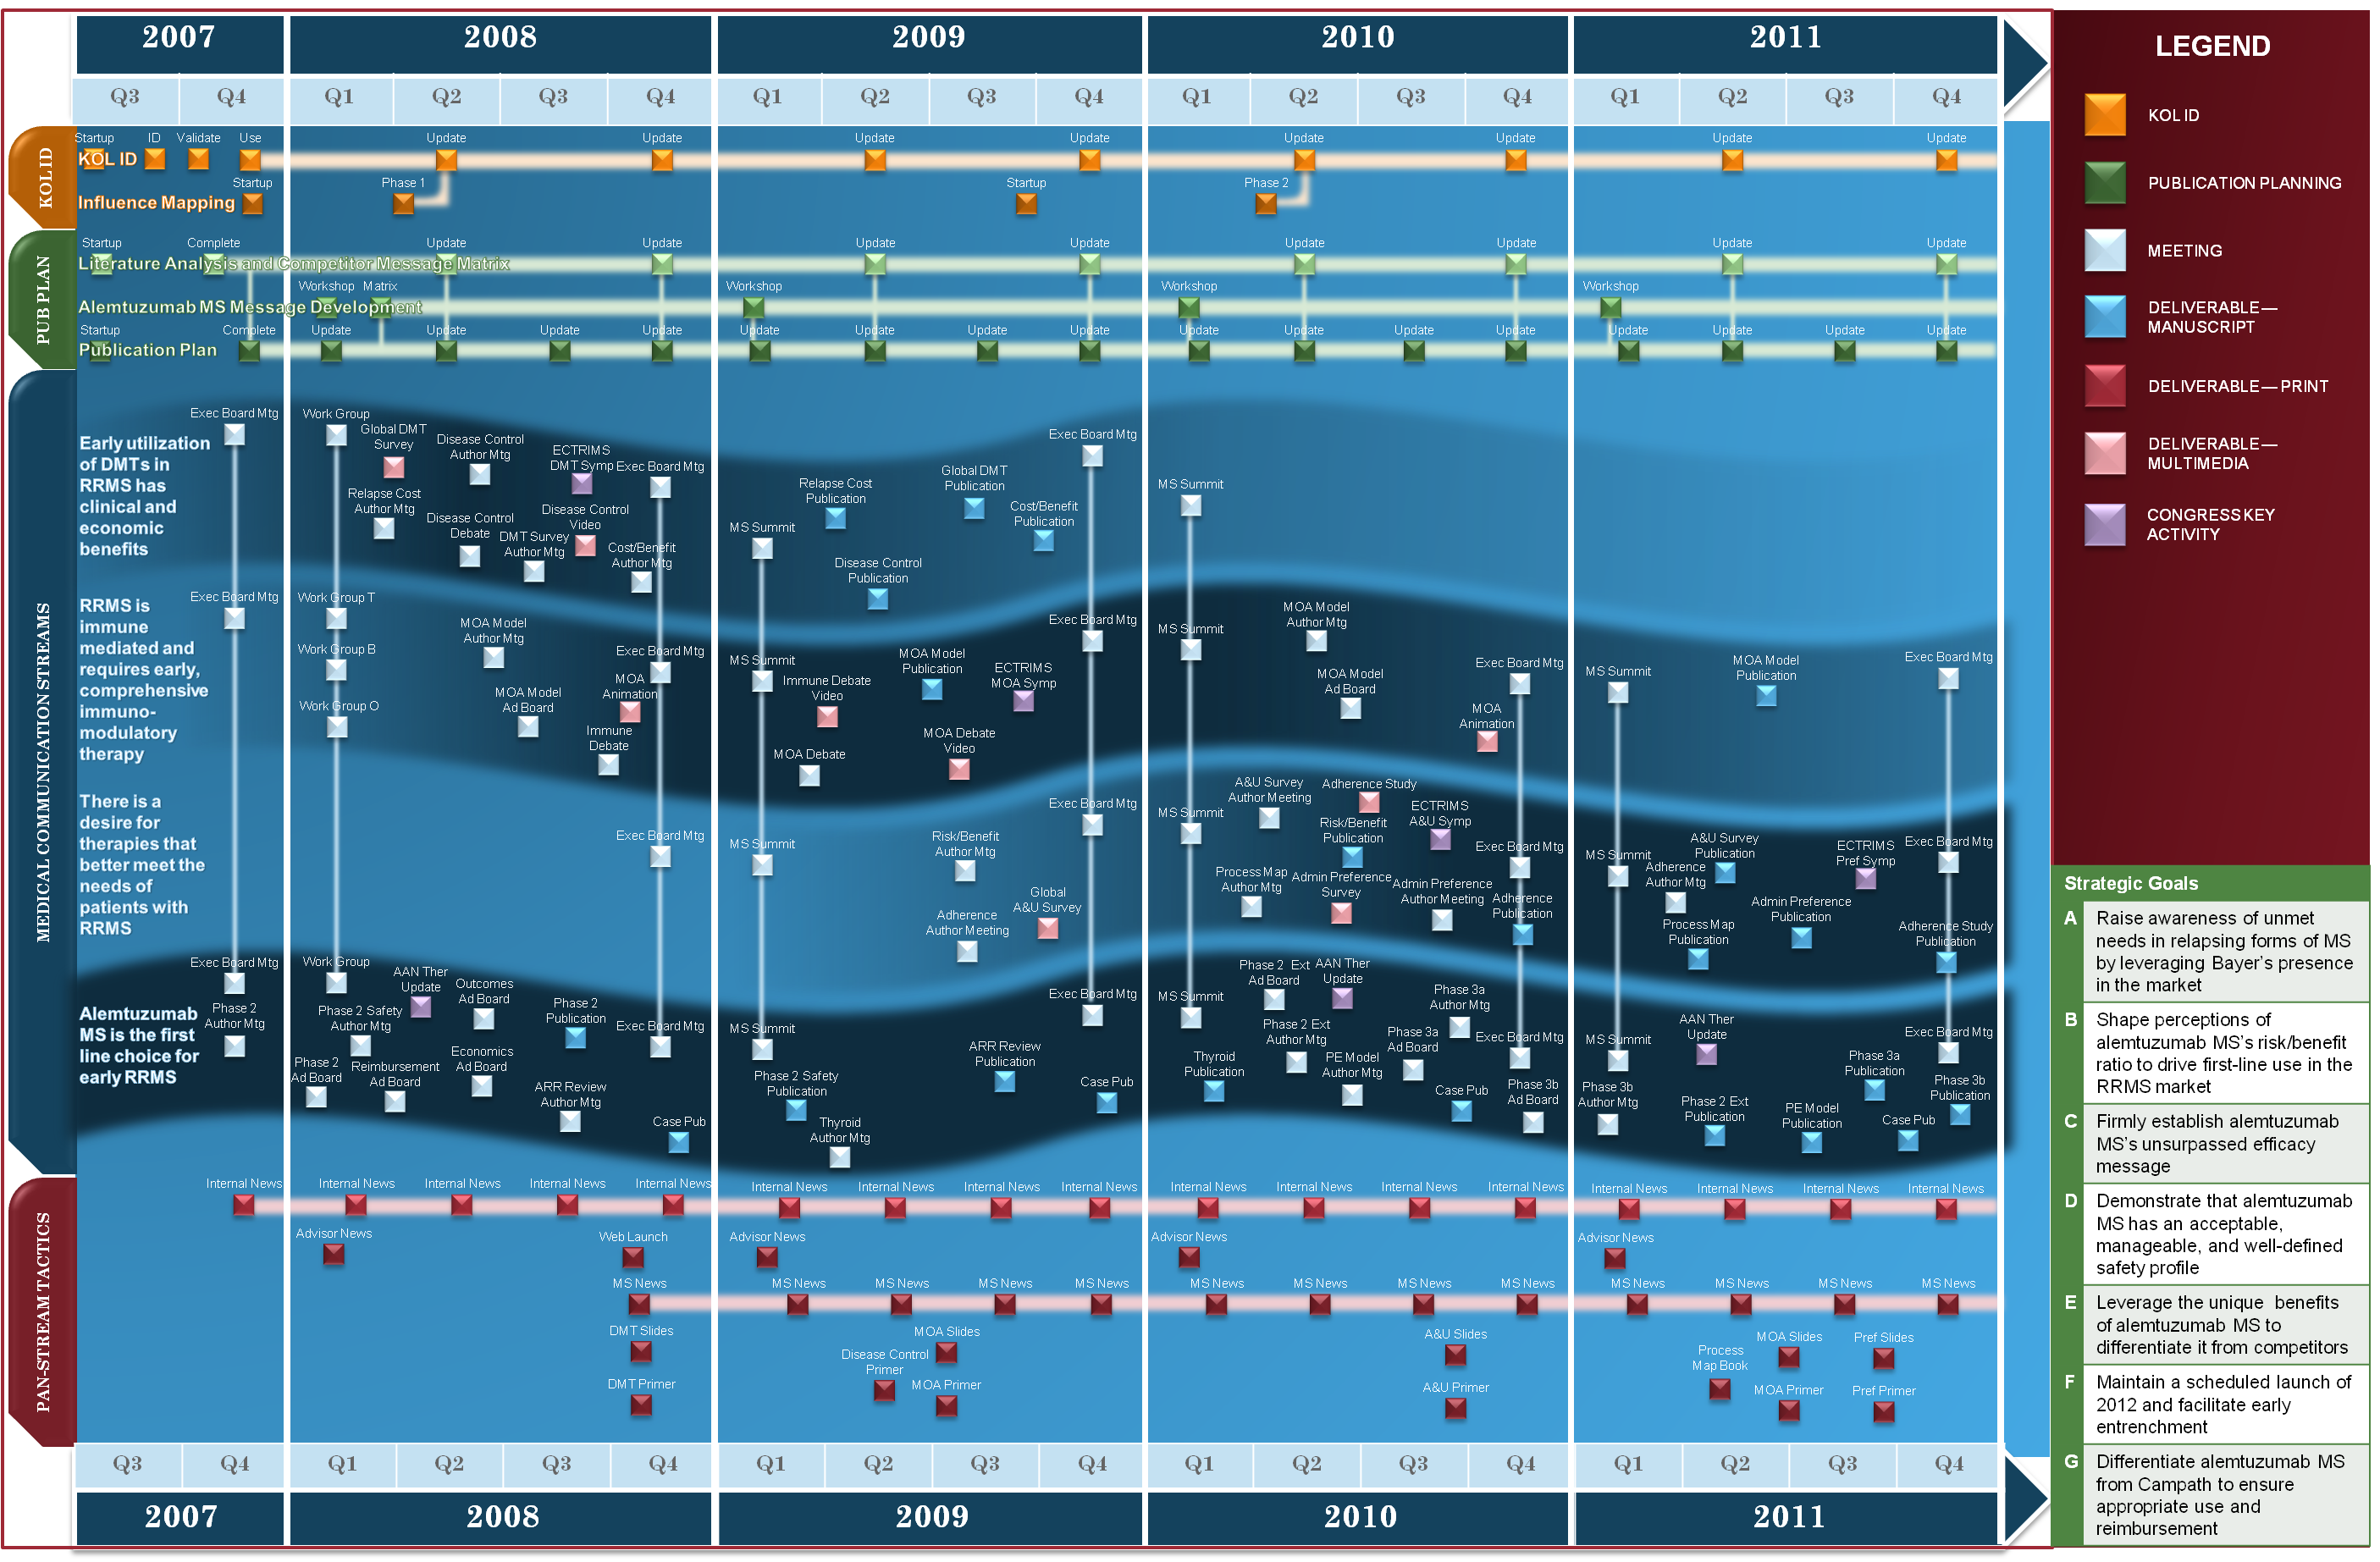
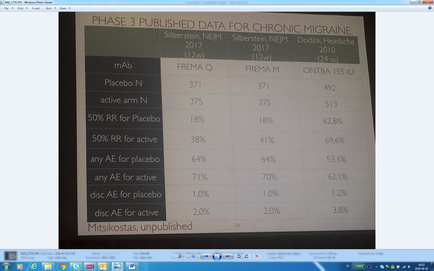
This is a table originally created by Mitsikostas (unpublished). Values on the x-axis are : Silberstein NEJM 2017 (12w) and Dodick Headache 2010 (24w). Values on the y-axis are : mAb Placebo N active arm N 50% RR for Placebo 50% RR for active any AE for placebo any AE for active disc AE for placebo and disc AE for active.
Type
Category
Source 1 of 2
-
Date
2018
Collection
-
Date
2018
Collection
We encourage you to view the image in the context of its source document(s) and cite the source(s) when using these images. However, to cite just this image alone, click the “Cite This Image” button and then paste the copied text.