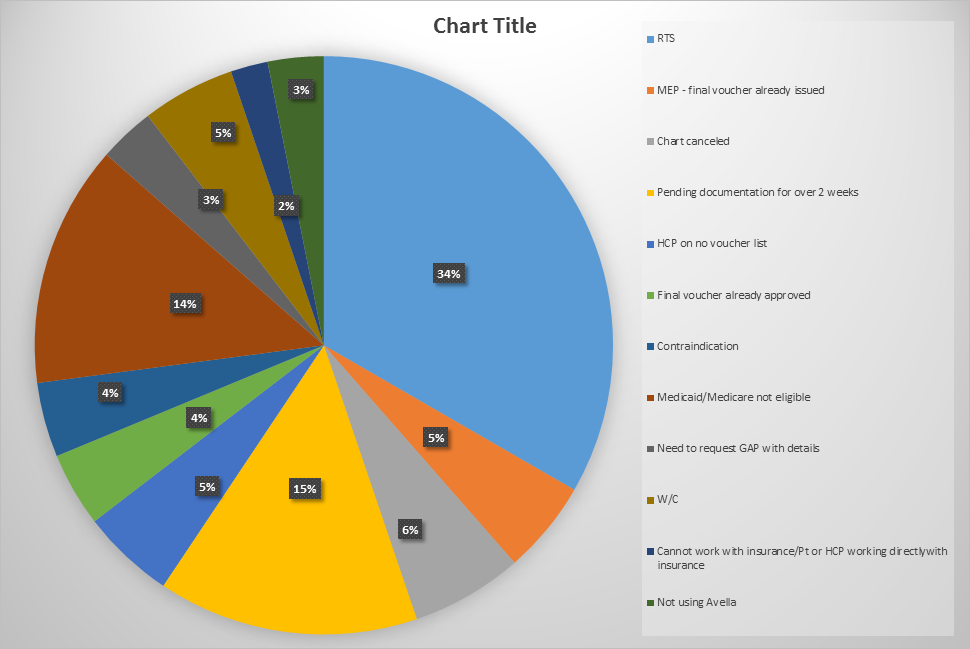
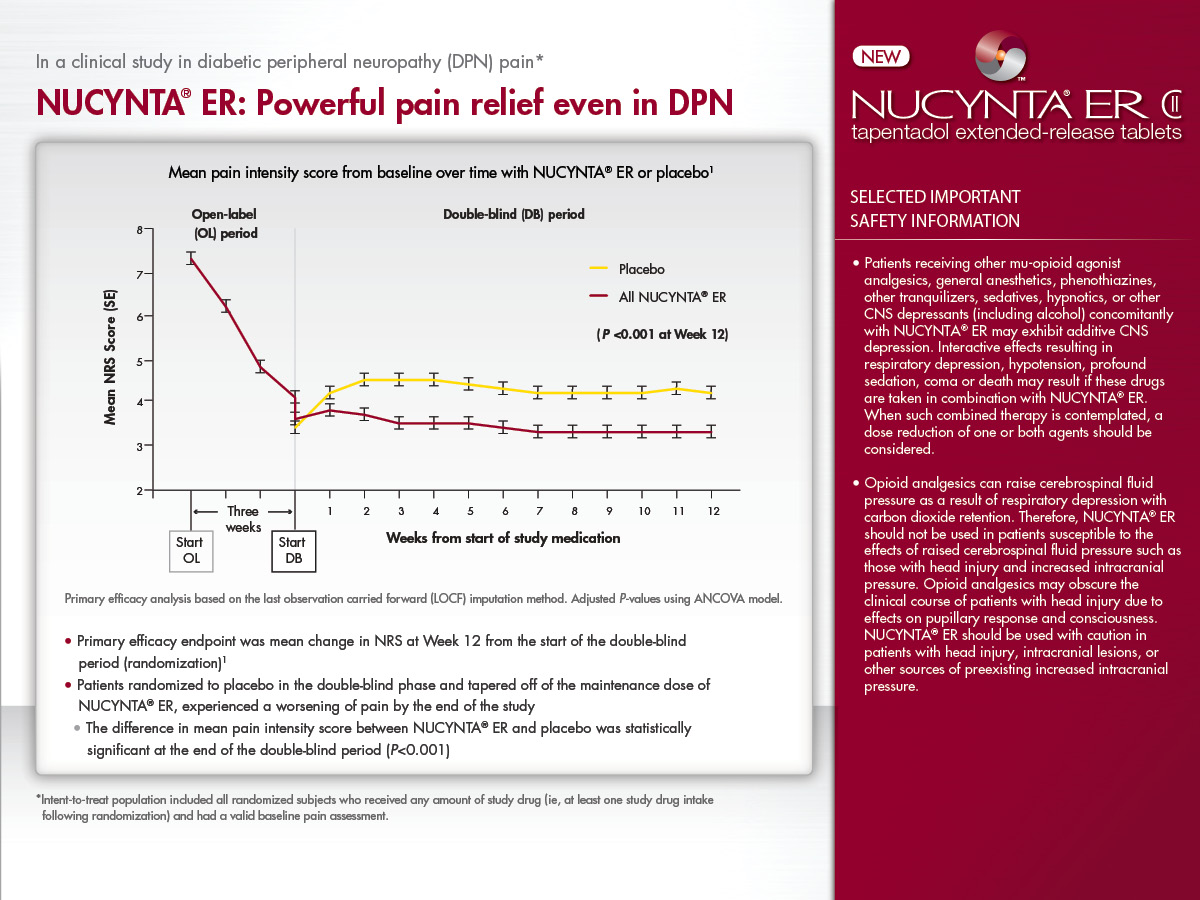
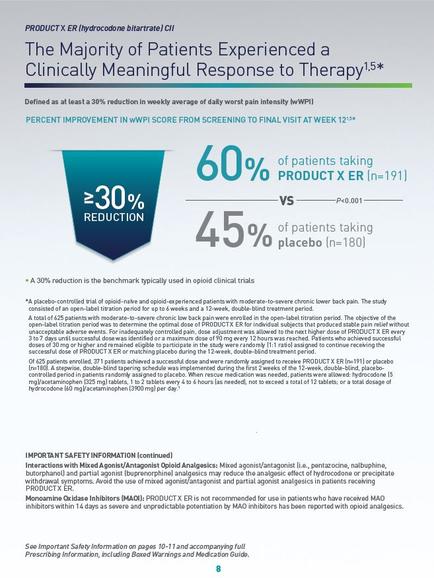
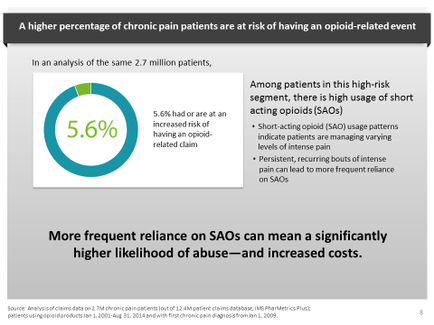
OIDA Image Collection
Filters:
Reset 
A pie chart that shows the percentage of chronic pain patients at risk of having an opioid-related event. The chart is divided into three sections. The first section is titled "In an analysis of the same 2.7 million patients 5.6% had or are at an increased risk of an opioid related claim". The second section is labeled "Among patients in this high-risk segment there is high usage of short acting opioid (says)". The third section is labelled "Short-acting opioid (SAO) usage patterns indicate patients are managing varying levels of intense pain. Persistent recurring bouts of intense pressure can lead to more frequent reliance on says." At the bottom of the chart there are two bullet points that explain the importance of more frequent reliance on says and how it can mean a significantly higher likelihood of abuse and increased costs.

Description Generated using AI

A pie chart that shows the percentage of chronic pain patients at risk of having an opioid-related event. The chart is divided into three sections. The first section is titled "In an analysis of the same 2.7 million patients 5.6% had or are at an increased risk of an opioid related claim". The second section is labeled "Among patients in this high-risk segment there is high usage of short acting opioid (says)". The third section is labelled "Short-acting opioid (SAO) usage patterns indicate patients are managing varying levels of intense pain. Persistent recurring bouts of intense pressure can lead to more frequent reliance on says." At the bottom of the chart there are two bullet points that explain the importance of more frequent reliance on says and how it can mean a significantly higher likelihood of abuse and increased costs.

Category

We encourage you to view the image in the context of its source document(s) and cite the source(s) when using these images. However, to cite just this image alone, click the “Cite This Image” button and then paste the copied text.

Information copied to your clipboard:

"A pie chart that shows the percentage of chronic pain patients at risk of having an opioid-related event. The chart is divided into three sections. T...