Title
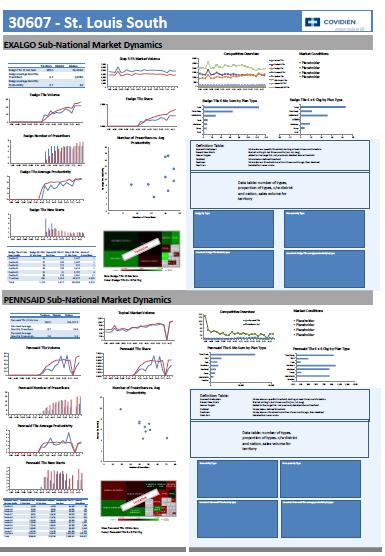
A collection of data related to the Exalgo Sub-National Market Dynamics (Exalgo) in St. Louis Missouri. The data is presented in a table format with multiple columns and rows.
The first column on the top left shows a line graph with different colors representing different data points. The second column shows a bar graph with a red line representing the data points the third column shows the data in a blue line and the fourth column displays the data on the right side of the table.
There are also several other data points scattered throughout the table including graphs charts and graphs that show the performance of the data. The first graph shows the number of data points in the market the second graph shows a decrease in the value of the market over time the fourth graph shows an increase in the number the fifth graph shows that the data has been fluctuating over time and the sixth graph shows how the data is fluctuating the seventh graph shows what the data looks like the eighth graph shows where the data appears to be fluctuating and the ninth graph shows whether the data was fluctuating.
- The table also has a title at the top that reads "30607 - St. Louis South" and a logo for the company "Covidien".
Category
Drug
Exalgo; Pennsaid
Source 1 of 5
-
Date
2011
Collection
-
Date
2011
Collection
-
Date
2011
Collection
-
Date
2011
Collection
-
Date
2011
Collection
We encourage you to view the image in the context of its source document(s) and cite the source(s) when using these images. However, to cite just this image alone, click the “Cite This Image” button and then paste the copied text.
