OIDA Image Collection
Filters:
Reset 
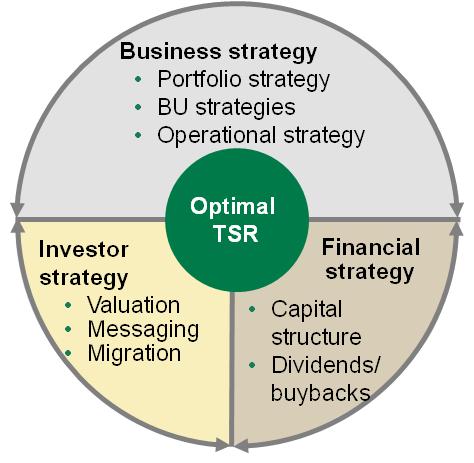
A circular diagram that represents the optimal TSR strategy. The diagram is divided into four sections each representing a different aspect of the strategy.<br /><br />The first section is labeled "Business strategy" and has a green circle in the center. The second section is titled "Portfolio strategy" with a label that reads "BU strategies". The third section is labeled "Operational strategy". The fourth section has labeled "Investor strategy" "Valuation messaging migration" "Capital structure" "Dividends/buybacks" and "Financial strategy".<br /><br />Overall the diagram is a visual representation of the different aspects of a business strategy and how they interact with each other.

Title

Optimal TSR diagram : Business strategy Investor strategy Financial strategy

Description Generated using AI

A circular diagram that represents the optimal TSR strategy. The diagram is divided into four sections each representing a different aspect of the strategy.

The first section is labeled "Business strategy" and has a green circle in the center. The second section is titled "Portfolio strategy" with a label that reads "BU strategies". The third section is labeled "Operational strategy". The fourth section has labeled "Investor strategy" "Valuation messaging migration" "Capital structure" "Dividends/buybacks" and "Financial strategy".

Overall the diagram is a visual representation of the different aspects of a business strategy and how they interact with each other.

We encourage you to view the image in the context of its source document(s) and cite the source(s) when using these images. However, to cite just this image alone, click the “Cite This Image” button and then paste the copied text.

Information copied to your clipboard:

"Optimal TSR diagram : Business strategy Investor strategy Financial strategy." OIDA Image Collection. Available at https://images.oida-resources.jhu....