


Title
Description 
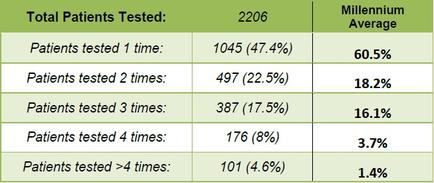
A table that shows the total patients tested in the Millennium Average. The table is divided into three columns each representing a different period of time. The first column is titled "Total Patients Tested: 2206" and shows the number of patients tested for each period. The second column is labeled "Patients tested 1 time: 1045 (47.4%)". The third column is "Patient tested 2 times: 497 (22.5%)" the fourth column is numbered "387 (17.5%) and the fifth column is labelled "16.1%". At the bottom of the table there is a note that reads "patient tested 4 times: 101 (4.6%)". This indicates that the table is showing that the total number of patient tested for the period is 2206 and that the average number is 60.5%. Overall the table shows that there are two columns in the table - "Millennium Average" and "Total Patient Tested".
Type
Category
-
Date
2013
Collection
We encourage you to view the image in the context of its source document(s) and cite the source(s) when using these images. However, to cite just this image alone, click the “Cite This Image” button and then paste the copied text.