Title
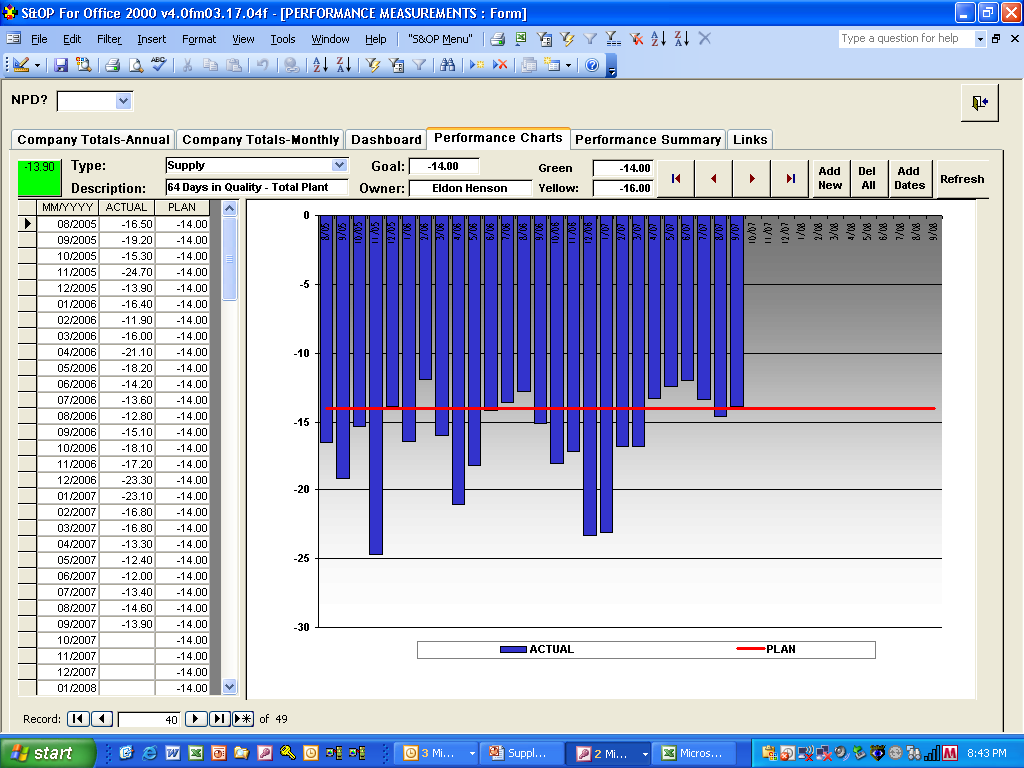
A screenshot of a software interface that is used to measure the performance of a company. The interface has a title "Performance Measurements" at the top followed by a description of the company's performance. Below the description there is a bar graph that shows the company total annual and company total monthly performance. The x-axis of the graph is labeled with the company name and the y-axis is labeled as "Company Total Annual". The graph shows that the company has achieved a significant increase in the performance over time.
There are several bars on the graph each representing a different period of time. The bars are arranged in a vertical axis with the highest bar representing the company and the lowest bar representing its performance. There are also several labels on the right side of the interface that provide additional information about the data such as the date time and location of the data. At the bottom of the screen there are several buttons and menus that can be used to navigate through the interface.
Category
-
Date
2007
Collection
We encourage you to view the image in the context of its source document(s) and cite the source(s) when using these images. However, to cite just this image alone, click the “Cite This Image” button and then paste the copied text.

![An infographic with the title "2014: The Year of the Digitally-Native HCP" [Healthcare Provider]. It is divided into four sections : A definition of "Digital Native" within this context a simple timeline a bar chart (with elements of a timeline) and 11 text boxes (each listing the date of a major Acceleration of Technology (ex : the creation of PubMed in 1996)). The infographic argues that "a doctor who qualified during or after the internet went mainstream and has relied on digital interactions through connective digital technologies for his/her entire professional career" is a Digital Native - that is any doctor born after 1970 who has therefore had "mainly digital experience". The bar chart shows that HCPs who were born earlier have had more years of practice before the internet was invented less internet exposure before promotion and less practicing HCPS/internet accessibility before their (eventual) retirement. The totality suggests a cultural divide between older HCPs and younger HCPs but does not discuss the challenges and opportunities extant. It could also be interpreted as unfavorably biased against older HCPs who are represented as "dinosaurs" (via clip art-style silhouettes). The background is white with graphic elements in blue pink green and orange with text in white blue and black.](https://oidaresourcesimages-cdn-endpoint-duhwc2gse6gdbng7.a01.azurefd.net/public/full/fa11dbfe-85e1-4eb0-8567-3a0c5fe6a6be.png)
