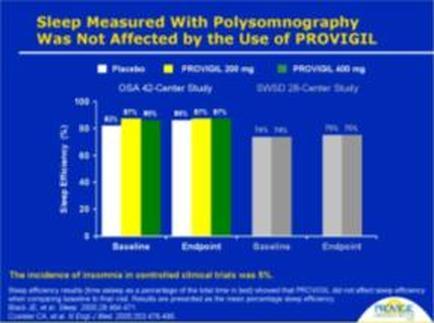
A bar graph that shows the results of a sleep measured with polysomnography was not affected by the use of prodigal. The x-axis of the graph is divided into four sections each representing a different stage of the study. The first section is labeled "Sleep Measurement" and shows that the study was conducted in the United States. The second section is titled "OSA 40-Center Study" and has a bar chart that shows that there are four bars in the graph. The first bar is colored green the second is yellow the third is orange and the fourth is gray. The bars are arranged in a horizontal axis with the highest bar at the top and the lowest at the bottom. The highest bar is labeled as "prodigal 200 mg" and the smallest bar is labelled as "Osa 40-Centre Study". There are also four bars on the graph each with a different color - green yellow and gray - representing the different stages of sleep measurement. The green bar represents the highest level of sleep the yellow bar represents low levels of sleep duration the gray bar represents high levels of low levels and and the gray bars represent high levels. The graph also has a legend that explains the meaning of each bar. The background of the image is blue and there is a logo in the bottom right corner.
Description 
Type
Category
Source 1 of 2
-
Date
2010
Collection
-
Date
2010
Collection
We encourage you to view the image in the context of its source document(s) and cite the source(s) when using these images. However, to cite just this image alone, click the “Cite This Image” button and then paste the copied text.