Title
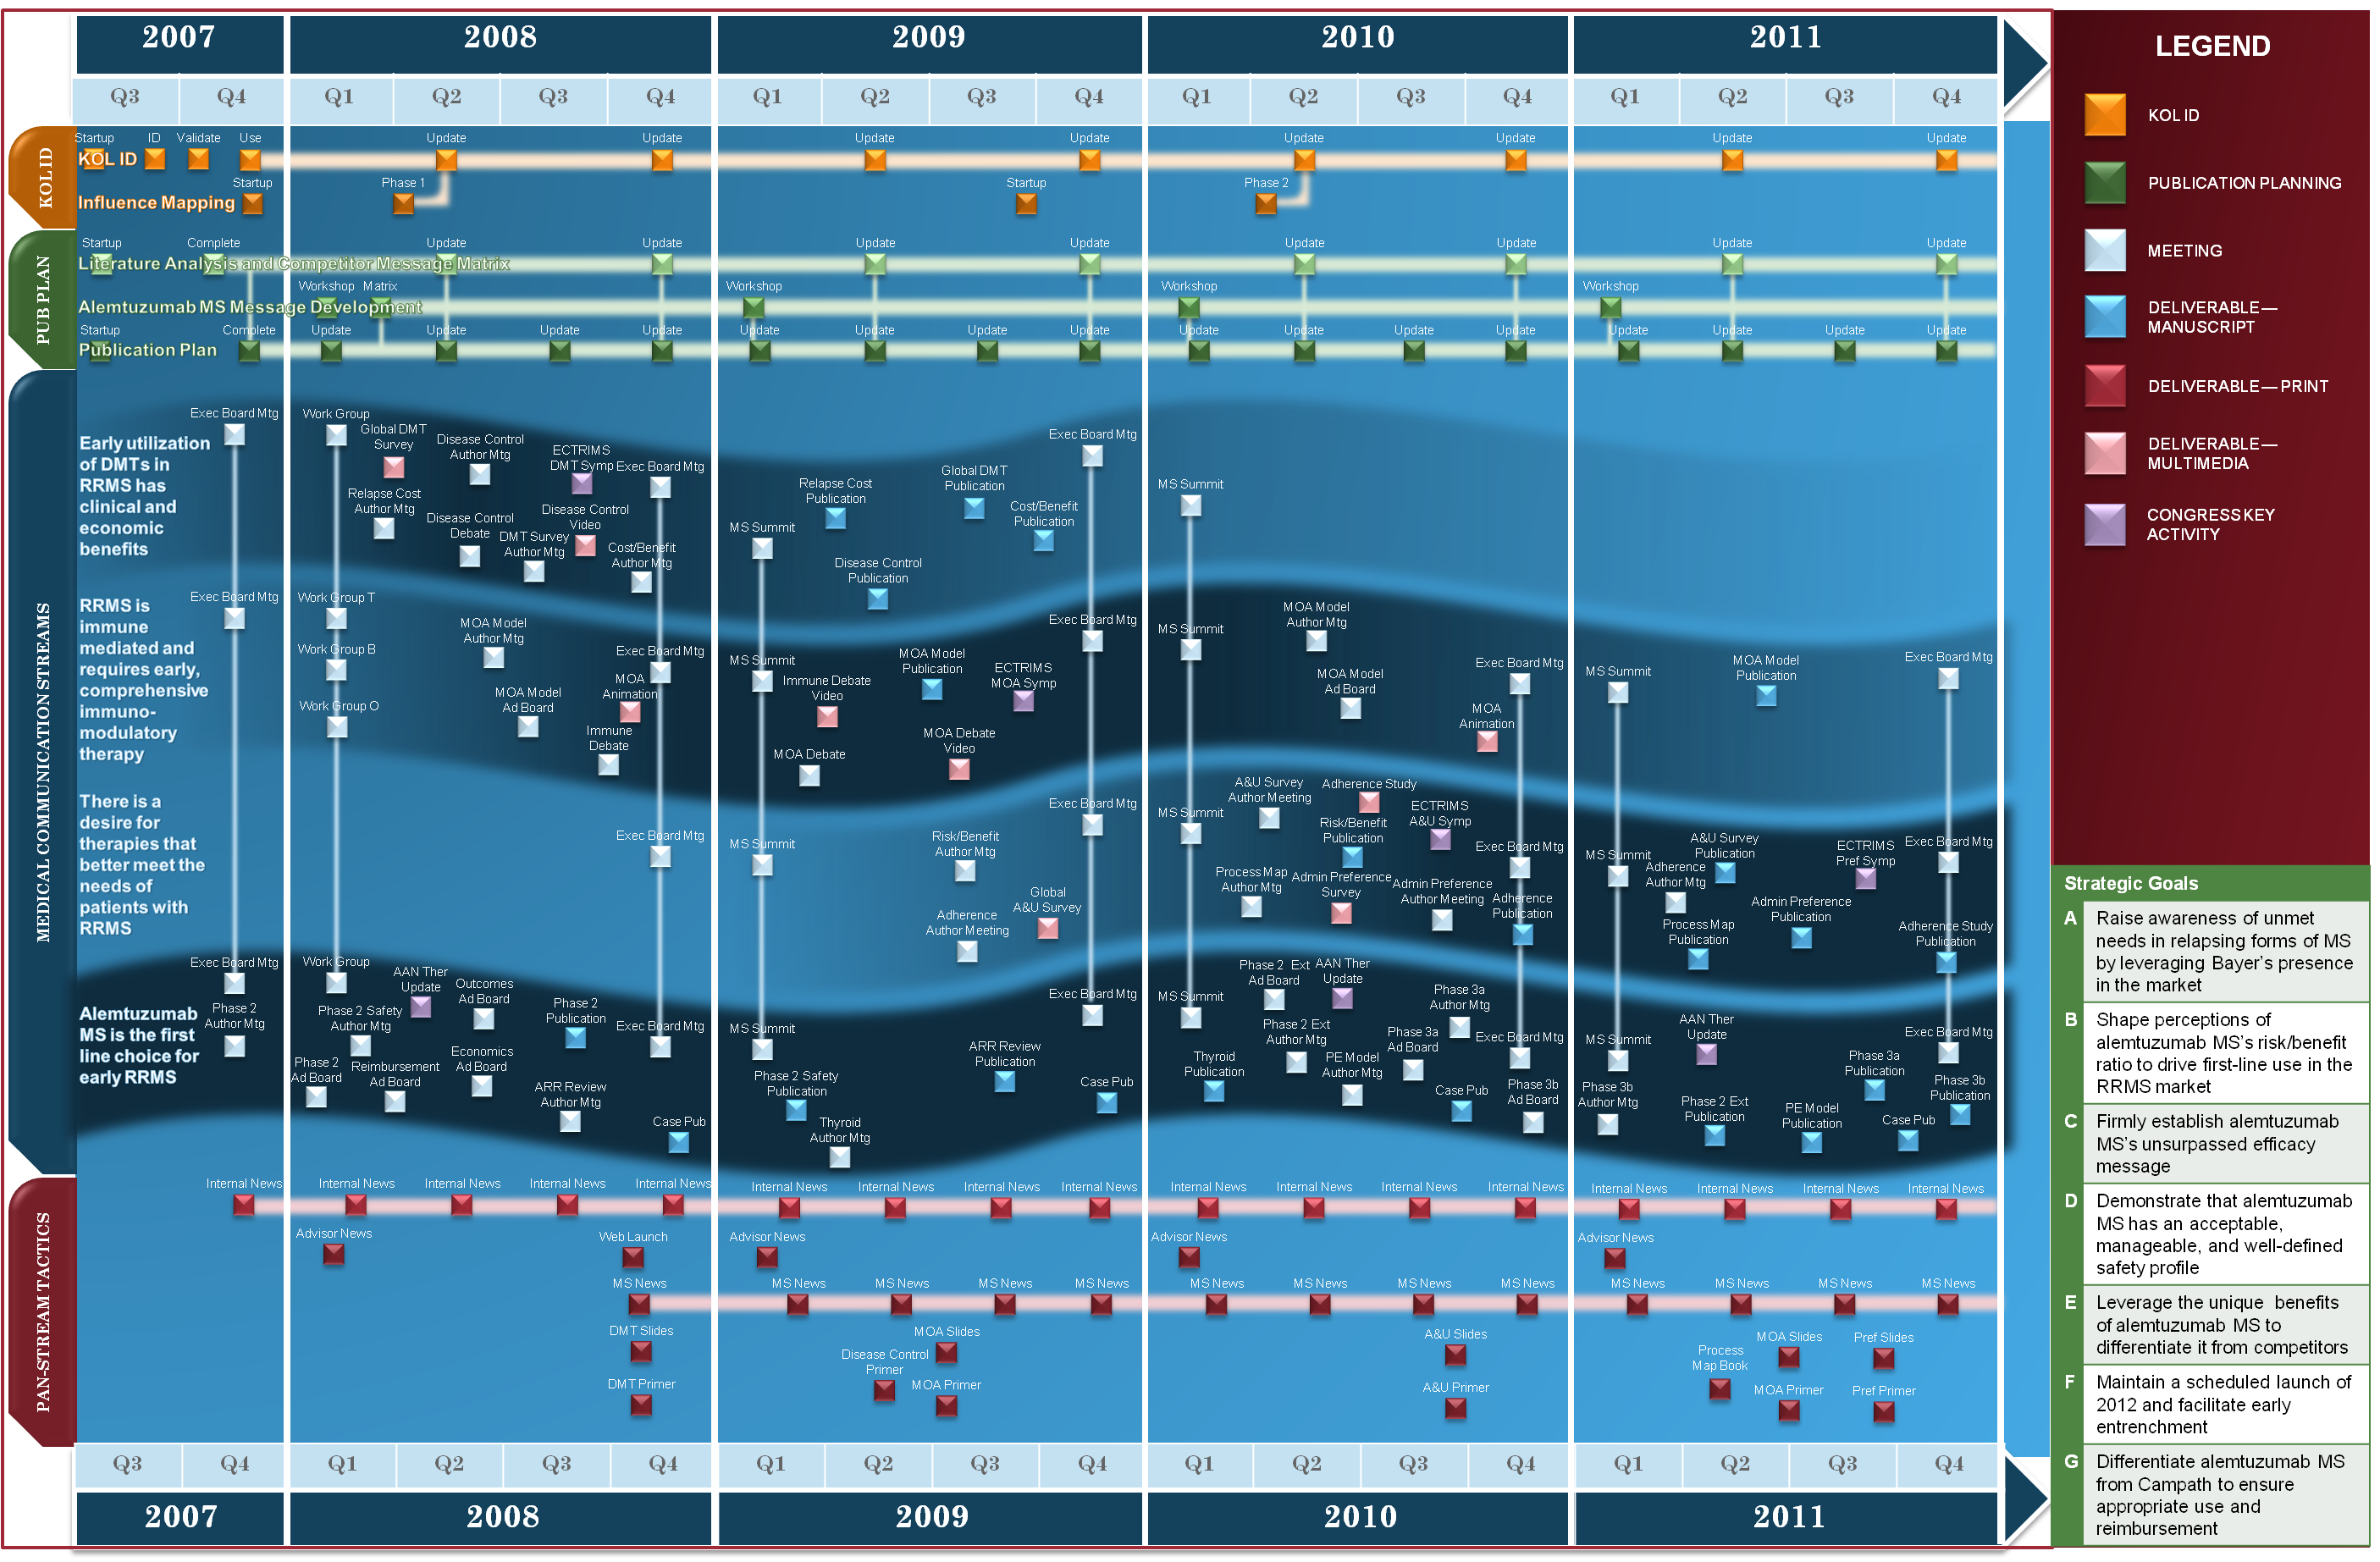
A timeline chart that shows the timeline of a project from 2007 to 2011. The chart is divided into 12 sections each representing a different year.
The first section is titled "2007" and shows the start and end dates of the project. The dates are arranged in a grid-like pattern with each section having a different color and label. The colors range from blue to red with the blue representing the start date and the red representing the end date. The labels are labeled with dates such as "2008" "2009" "2010" "2011" "2012" "2013" "2014" "2015" "2016" "2017" "2018" "2019" "2020" "21" "22" "23" "24" "25" "26" "27" "28" "29" "30" "31" "32" "33" "34" "35" "36" "37" "38" "39" "40" "41" "42" "43" "44" "45" "46" "47" "48" "50" "51" "52" "53" "54" "55" "56" "57" "58" "59" "60" "61" "62" "63" "64" "65" "66" "67" "68" "69" "70" "71" "72" "73" "74" "75" "76" "78" "79" "80" "81" "82" "83" "84" "85" "86" "87" "88" "90" "91" "92" "93" "94" "95" "96" "97" "98" "99" "100" "102" "104" "105" "106" "107" "108" "110" "111" "112" "113" "114" "115" "116" "117" "118" "120" "121" "122" "123" "134" "125" "126" "127" "128" "129" "130" "131" "132" "133" "140" "135" "150" "166" "170" "175" "176" "180" "190" "200" "220" "241" "260" "270" "240" "290" "251" "267" "280" "300" "320" "321" "330" "350" "380" "390" "400" "450" "500" "550" "600" "650" "700" "750" "800" "900" "1000" "1100" "1200" "1500" "1600" "1800" "2000" "2500" "3000" "4000" "5000" "6000
-
Date
2012
Collection
We encourage you to view the image in the context of its source document(s) and cite the source(s) when using these images. However, to cite just this image alone, click the “Cite This Image” button and then paste the copied text.


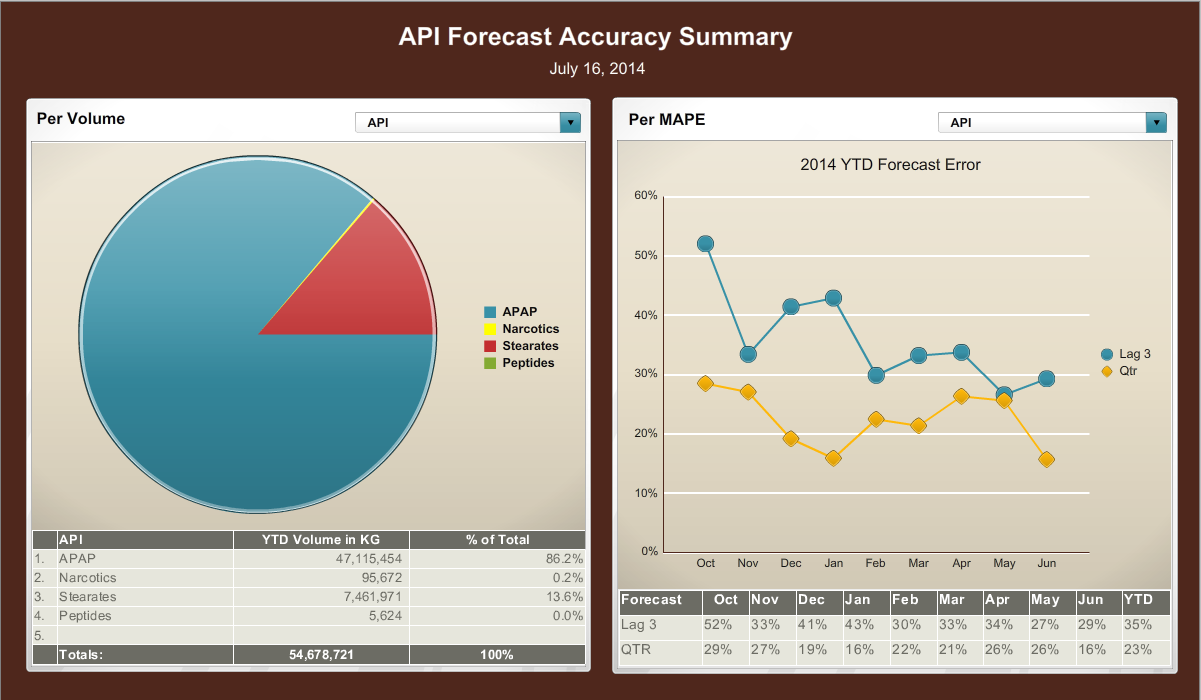
![This is a pie chart showing the top 10 opioids by total prescriptions. The 10 drugs ordered from highest market share to lower market share are : OxyContin (new formulation) Fentanyl patch Long-acting morphine Opana ER Kadian Avinza Butrans OxyContin [previous formulation?] Long-acting oxycodone and Duragesic. The top 3 opioids account for 84.84% of the market share and are tightly clustered (between 27.46% and 29.07% each).](https://oidaresourcesimages-cdn-endpoint-duhwc2gse6gdbng7.a01.azurefd.net/public/full/afbedd91-ff90-4fa3-a3a4-88a63d56c0b2.png)
