


Title
Description 
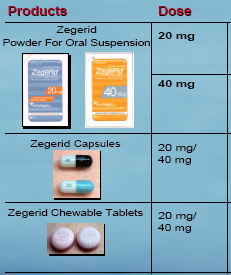
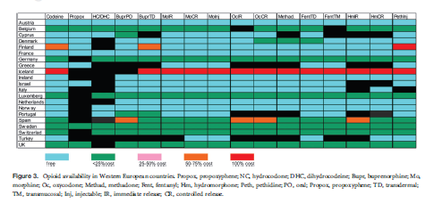
A table that shows the number of people who have been diagnosed with cancer in Western European countries. The table is divided into three columns each representing a different country. The first column is labeled "Figure 3. Opioid availability in Western Europe countries: Propolis Propolis-propolis N.C. hydroxide DHC hydrochloric acid hydroxychloroquine pupa hyphenophosphine and hydrochloride. The second column is titled "Hydroxide" and shows the percentage of people diagnosed with the condition. The third column is numbered "Free" and has a list of the countries that have been affected by the condition with the highest percentage being "Free". At the bottom of the table there is a legend that explains the meaning of each color in the table. The colors used in the chart are blue green red orange and yellow. The text on the table provides further information about the condition and the percentage.
Type
Category
-
Date
2014
Collection
We encourage you to view the image in the context of its source document(s) and cite the source(s) when using these images. However, to cite just this image alone, click the “Cite This Image” button and then paste the copied text.