Title
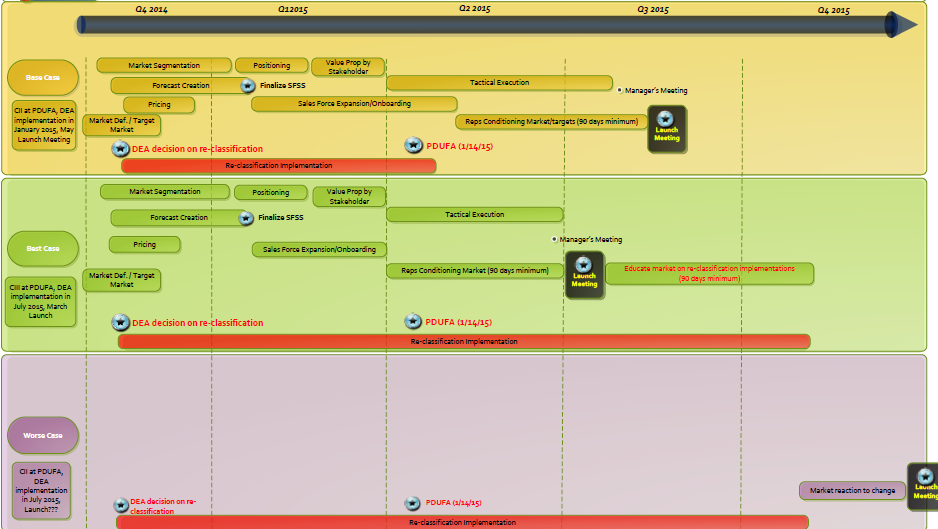
A timeline chart that shows the timeline of a project or project. The chart is divided into six sections each representing a different stage of the project.
The first section is labeled "Project Management" and shows the start and end dates of the day. The second section is titled "Planning" and has a list of tasks and tasks that need to be completed. The third section has a timeline that starts with the start of the process and ends with the end date. The fourth section has an overview of the timeline including the date time and location of each task. The fifth section has the date and time of the event as well as the start date and the start time.
At the top of the chart there is a blue arrow pointing to the next stage indicating that the project is in progress. The timeline is color-coded with different shades of green yellow and orange representing different stages. There are also several icons scattered throughout the chart that represent the different tasks and events that will be completed in each stage.
Category
Source 1 of 2
-
Date
2014
Collection
-
Date
2014
Collection
We encourage you to view the image in the context of its source document(s) and cite the source(s) when using these images. However, to cite just this image alone, click the “Cite This Image” button and then paste the copied text.








![This is an infographic consisting of 6 boxes : Measures of Multiple Concepts (Include Symptoms and Impacts) [Measures of] Physical Function / Abilities Measures of Pain Measures of Fatigue Measures of Health Status and Measures of Sleep. There are between 1-7 examples listed within each box. For example the DePaul Symptom Questionnaire (DSQ) is one (of 4) Measures of Multiple Concepts. <br />](https://oidaresourcesimages-cdn-endpoint-duhwc2gse6gdbng7.a01.azurefd.net/public/full/ea27e5f5-b0fe-4f8e-9ac4-756ccacfd70b.jpeg)
