


Title
Description
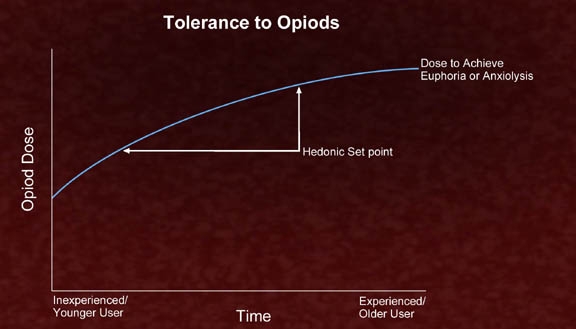
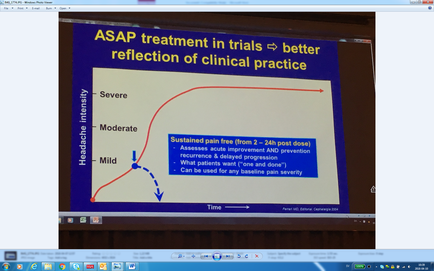
This is a run chart showing the relationship between Time (on the x-axis) and Headache intensity (on the y-axis). It suggests that earlier treatment is preferable as Headache intensity increases over Time. It posits that most patients are being (successfully) treated within the first 2 hours while their headaches are still Mild.
Type 
Category
Source 1 of 2
-
Date
2018
Collection
-
Date
2018
Collection
We encourage you to view the image in the context of its source document(s) and cite the source(s) when using these images. However, to cite just this image alone, click the “Cite This Image” button and then paste the copied text.