Title
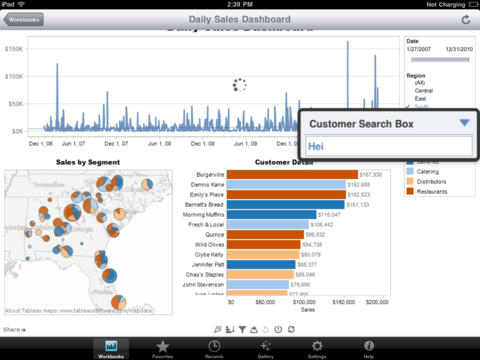
A screenshot of a daily sales dashboard on an iPad. There are three charts on the dashboard.
Along the top there is a blue bar chart showing daily sales (in dollars) from January 27 2007 to December 31 2010. The title of this chart is cut off and not readable.
On the bottom left there is a heat map overlaid on a map of the American South East. The heat map is labeled "Sales by Segment". On the bottom right there is a bar chart labeled "Customer Detail" showing sales by customer.
A pop-up window is on top of the unlabeled and customer detail charts. The pop-up is labeled "Customer Search Box" and the name "Hei" is typed into the search box.
Category
Source 1 of 14
-
Date
2014
Collection
-
Date
2014
Collection
-
Date
2014
Collection
-
Date
2014
Collection
-
Date
2014
Collection
-
Date
2014
Collection
-
Date
2014
Collection
-
Date
2014
Collection
-
Date
2014
Collection
-
Date
2014
Collection
-
Date
2014
Collection
-
Date
2015
Collection
-
Date
2014
Collection
-
Date
2014
Collection
We encourage you to view the image in the context of its source document(s) and cite the source(s) when using these images. However, to cite just this image alone, click the “Cite This Image” button and then paste the copied text.

