 
                                            Title
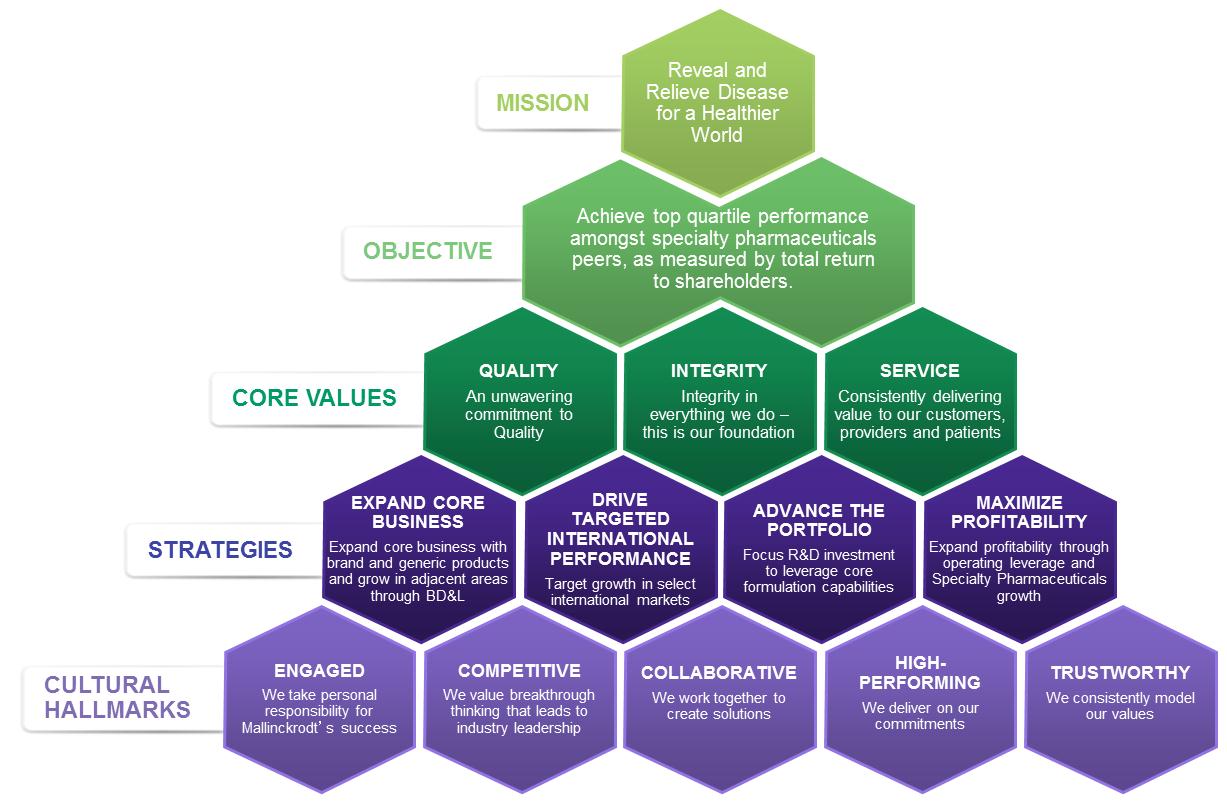
A hexagon-shaped diagram that represents the organizational structure of a company. The hexagon is divided into six sections each representing a different aspect of the company's mission and objectives.
The first section is labeled "Objective" and has a green arrow pointing to the top of the hexagon. The second section is titled "Reveal and Relieve Disease for a Healthier World". The third section has a label that reads "Achieve top quality performance among specialty pharmaceuticals peers as measured by total return to shareholders." The fourth section has labeled "Core Values" and lists the core values of the organization such as "Quality" "Integrity" "Service" "Strategies" "Expand Core Business" "Drive Targeted International Performance" "Advance the Portfolio" "Maximize Profitability" "Engaged" "Competitive" "Collaborative" "High-Performing" and "Trustworthy".
Overall the diagram is a visual representation of the different aspects of a business's mission objectives and strategies.
Type
Category
- 
                                                                        
                                                                                                            Date 2014 Collection 
We encourage you to view the image in the context of its source document(s) and cite the source(s) when using these images. However, to cite just this image alone, click the “Cite This Image” button and then paste the copied text.


                        ![An infographic that explains the benefits of full therapeutic value for patients like Patrick. It has a blue background with white text and an illustration of Patrick in the center. The illustration is of a man with his arms crossed and a serious expression on his face. <br /><br />On the left side of the image there is a line graph that shows hours on the x-axis and the pain plasma hydromorphone level on the y-axis demonstrating that "Exalgo remained above 50% of C[?] for more than 90% of dosing interval" as compared to hydromorphone.  <br /><br />The right side of the graphic has recommended instructions on how best to treat a patient like Patrick with Exalgo and also has important risk information for Exalgo.](https://oida-resources-images.azureedge.net/public/full/3d05d7df-6b4f-46b4-a36b-ee5f924ecb77.png) 


                        