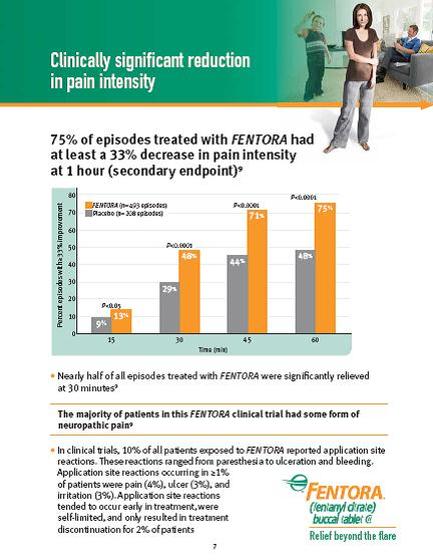
An idiographic that explains that 75% of episodes treated with mentor had at least a 33% decrease in pain intensity at 1 hour (secondary endpoint). The idiographic is divided into three sections. The first section titled "Clinically significant reduction in pain intensity" shows a bar graph that shows the percentage of episodes that were treated with the treatment. The x-axis of the graph represents the time period while the y-axis represents the number of episodes. The bars are color-coded with orange representing the highest percentage and gray representing the lowest percentage. The graph shows that nearly half of all episodes treated in the mentors clinical trial had some form of neuropathy pain with 10% of all patients exposed to FENTORTRA reported an application site. The idiographic also includes a brief description of the treatment which states that the treatment was successful and that the majority of the patients treated were significantly relieved at 30 minutes.
Description 
Type
Category
Source 1 of 2
-
Date
2012
Collection
-
Date
2012
Collection
We encourage you to view the image in the context of its source document(s) and cite the source(s) when using these images. However, to cite just this image alone, click the “Cite This Image” button and then paste the copied text.