


Title
Description
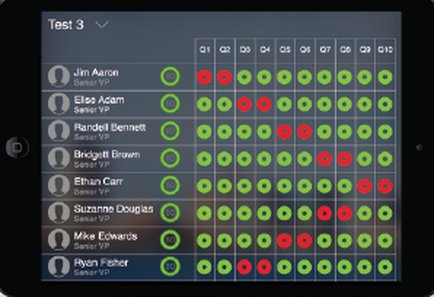
This is a data visualization showing binary values (Green or Red) for 8 different people across 10 different quarters. For example Jim Aaron (Senior VP) has red for Quarters 1-2 and green for Quarters 3-10.
Type 
Category
Source 1 of 7
-
Date
2016
Collection
-
Date
2016
Collection
-
Date
2016
Collection
-
Date
2018
Collection
-
Date
2016
Collection
-
Date
2016
Collection
-
Date
2016
Collection
We encourage you to view the image in the context of its source document(s) and cite the source(s) when using these images. However, to cite just this image alone, click the “Cite This Image” button and then paste the copied text.