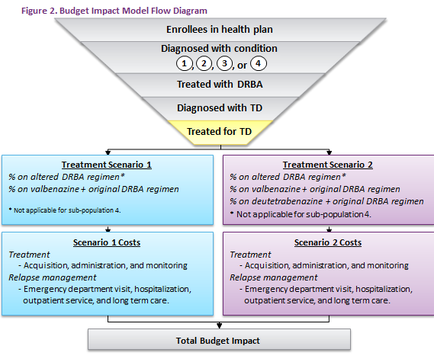
A diagram that shows the budget impact model flow diagram for a health plan. It is a pyramid-shaped diagram that represents the total budget impact of the plan. The diagram is divided into three sections. The top section is labeled "Enrolls in health plan" and has a label that reads "Diagnosed with condition". Below the label there is a section titled "Treated with DRBA Diagnosed with TD". The diagram also has a description of the treatment scenario which states that the plan is on altered DRBA regimen and that it is not applicable for sub-population 4. The treatment scenario is "Treatment Scenario 1 Costs". There are three sections in the diagram each with a different color - blue green and purple. The blue section is titled "Acquisition administration and monitoring" and the green section is labelled "Emergency department visit hospitalization outpatient service and long term care." The purple section has a list of treatment scenarios including "Treatments Scenario 2 Costs" and "Total Budget Impact".

Category
-
Date
2017
Collection
We encourage you to view the image in the context of its source document(s) and cite the source(s) when using these images. However, to cite just this image alone, click the “Cite This Image” button and then paste the copied text.