Title
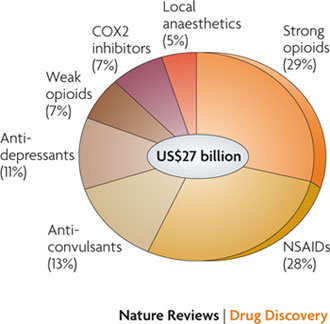
A pie chart that shows the market share of various drug categories in the United States totaling $27 billion dollars in sales during an unspecified time frame. Strong opioids (29%) NSAIDs (28%) Anti-convulsants (13%) Anti-depressants (11%) Weak opioids (7%) COX2 inhibitors (7%) and Local anaesthetics (5%) are all represented.
Type
Category
Source 1 of 4
-
Date
2017
Collection
-
Date
2017
Collection
-
Date
2017
Collection
-
Date
2017
Collection
We encourage you to view the image in the context of its source document(s) and cite the source(s) when using these images. However, to cite just this image alone, click the “Cite This Image” button and then paste the copied text.
