Title
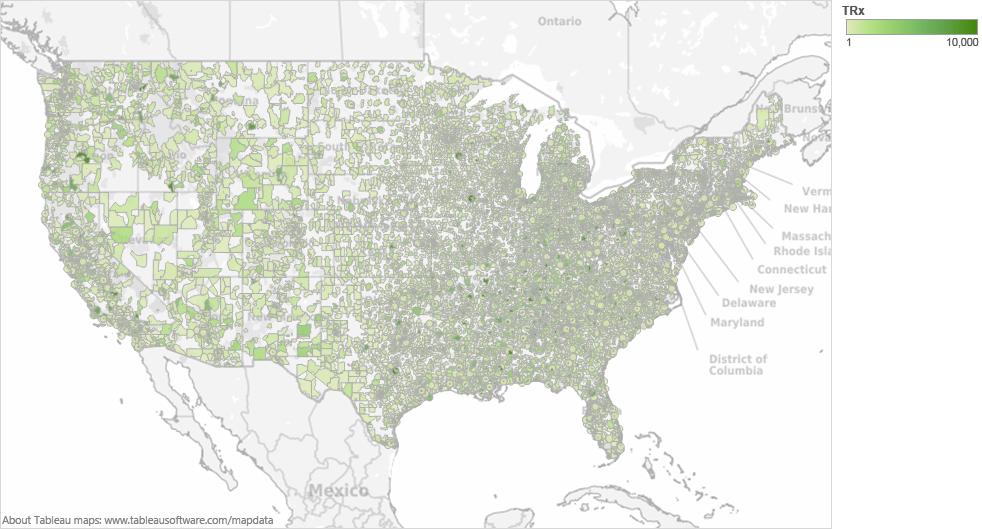
A map of the United States showing the percentage of people living in each state. The map is color-coded with different shades of green representing different areas of the country. The majority of the map is white while the rest of the states are colored in shades of gray.
The map also shows the major cities and towns within the state including New York New Jersey Maryland and the District of Columbia. The cities are densely packed together with some areas being more densely populated and others being more sparsely populated. There are also some major highways and highways visible in the map as well as some major cities such as New York City New York State and New Jersey. The image also includes a legend at the bottom that explains the different colors and symbols used to represent the different areas.
Category
Source 1 of 2
-
Date
2015
Collection
-
Date
2012
Collection
We encourage you to view the image in the context of its source document(s) and cite the source(s) when using these images. However, to cite just this image alone, click the “Cite This Image” button and then paste the copied text.
