


Title
Description
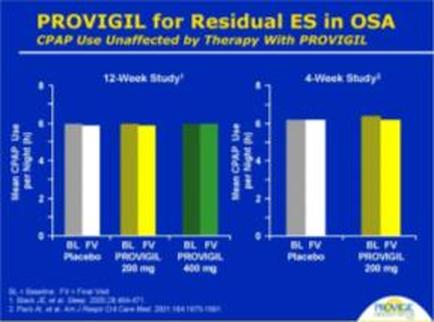
This is 2 different bar charts. The one on the left shows the effects of using a Placebo 200 mg of Provigil or 400 mg of Provigil during a 12-week study. The one on the right shows the effects of using a Placebo or 200 mg of Provigil during a 4-week study.
Type 
Category
Source 1 of 2
-
Date
2010
Collection
-
Date
2010
Collection
We encourage you to view the image in the context of its source document(s) and cite the source(s) when using these images. However, to cite just this image alone, click the “Cite This Image” button and then paste the copied text.

![An advertisement for a Fentanyl Transdermal System. It shows a close-up of a person's skin with a patch on it. The patch is labeled "Fentanyl Transdermal System 75 ug/hr" and is located on the right side of the image. On the left side there is text that reads "Think Mallinckrodt". Below the patch there are four small boxes with different colors - red blue green and white - arranged in a grid-like pattern showing boxes for the patches at different dosages. <br /><br />The bottom section of the advertisement has a table with a list of the products including the NDC # product description size and McKesson [ID #?]. The bottom of the box reads "See important risk information including full boxed warning on reverse size" and also includes the Mallinckrodt and Covidien logos.](https://oida-resources-images.azureedge.net/public/full/e2aaca7e-d51c-4c0c-8cd6-dba899f5af98.png)