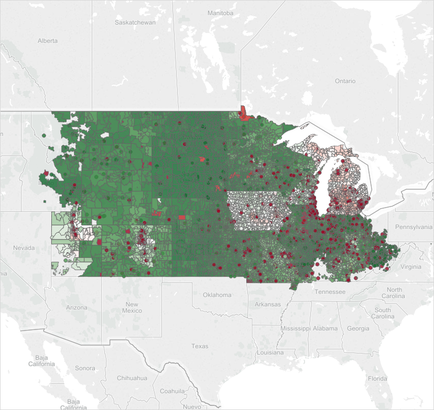
OIDA Image Collection
Filters:
Reset 
A map of the United States showing the distribution of red dots in different regions of the country. The map is color-coded with different shades of green representing different areas of the state. The red dots are scattered across the map with some areas being darker and others being lighter. The green areas are densely packed together while the red dots appear to be scattered throughout the map. The map also shows the major cities and towns within the state including New Mexico New Mexico City Oklahoma City and Oklahoma City. There are also several smaller cities and highways visible in the map as well. The cities are labeled with their names and there is a large red dot in the center of the map that appears to be a small town or village.

Description Generated using AI

A map of the United States showing the distribution of red dots in different regions of the country. The map is color-coded with different shades of green representing different areas of the state. The red dots are scattered across the map with some areas being darker and others being lighter. The green areas are densely packed together while the red dots appear to be scattered throughout the map. The map also shows the major cities and towns within the state including New Mexico New Mexico City Oklahoma City and Oklahoma City. There are also several smaller cities and highways visible in the map as well. The cities are labeled with their names and there is a large red dot in the center of the map that appears to be a small town or village.

Type Generated using AI

We encourage you to view the image in the context of its source document(s) and cite the source(s) when using these images. However, to cite just this image alone, click the “Cite This Image” button and then paste the copied text.

Information copied to your clipboard:

"A map of the United States showing the distribution of red dots in different regions of the country. The map is color-coded with different shades of ...