


Title
Description
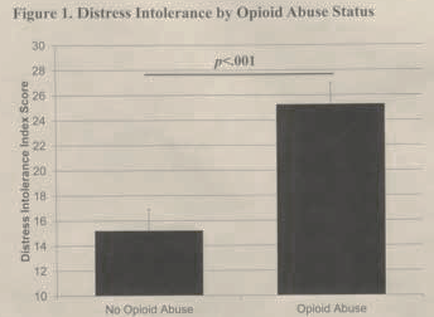
This is a bar graph that compares the Distress Intolerance Index Score (on the y-axis) for people with No opioid abuse (DITS = 15) vs. people with Opioid abuse (DITS = 25) where p<001. Note that the scale begins at DITS = 10 (that is the bottom third of the y-axis is not shown).
Type 
Category
Source 1 of 3
-
Date
2015
Collection
-
Date
2015
Collection
-
Date
2015
Collection
We encourage you to view the image in the context of its source document(s) and cite the source(s) when using these images. However, to cite just this image alone, click the “Cite This Image” button and then paste the copied text.