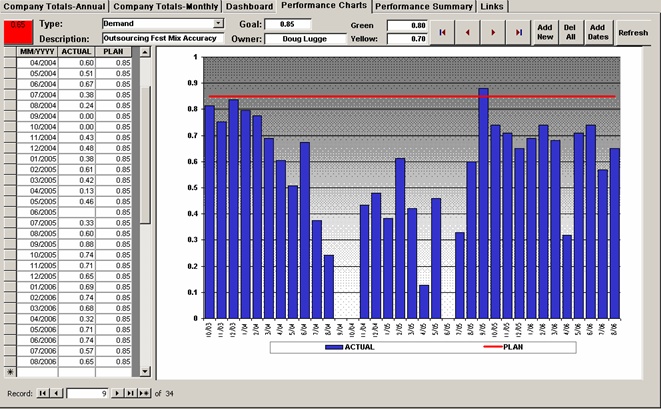
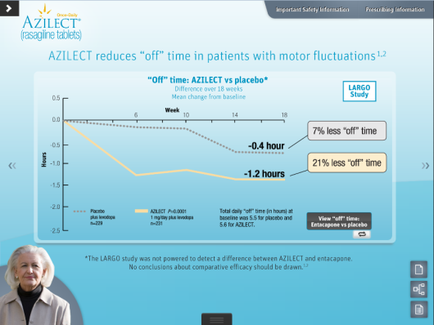
A screenshot of a webpage from the anilest website. The webpage is titled "anilest reduces "off" time in patients with motor fluctuations 1.2". The page has a blue background with a white header and footer. The main content of the page is a line graph that shows the relationship between the two variables. The x-axis represents the time period while the y-axis shows the percentage of patients who have been diagnosed with the virus. The graph shows that the virus has decreased from 0.4 hours to 1.12 hours with the percentage decreasing from 0 to 2 hours. The line graph also shows that there is a slight decrease in the number of patients with a virus as indicated by the text on the page. On the right side of the image there is an image of a woman with white hair wearing a white lab coat smiling at the camera. Below the graph there are two buttons - "View" and "Largo Study". The text below the graph explains that the study was not powered to detect a difference between anilest and entacapone and that no conclusions about comparative efficacy should be drawn.
Description 
Type
Category
Source 1 of 3
-
Date
2013
Collection
-
Date
2013
Collection
-
Date
2013
Collection
We encourage you to view the image in the context of its source document(s) and cite the source(s) when using these images. However, to cite just this image alone, click the “Cite This Image” button and then paste the copied text.