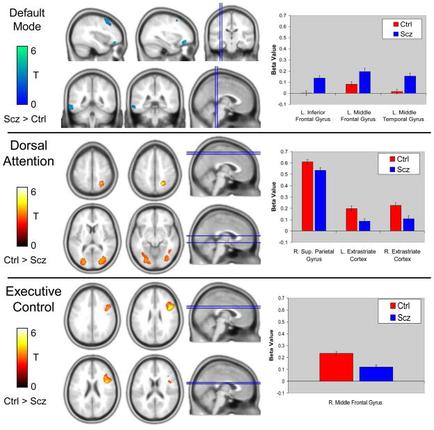
OIDA Image Collection
Filters:
Reset 
A diagram that shows the different types of salience network connectivity in the brain. It is divided into six sections each representing a different type of brain. The first section on the top left shows the cerebellum of the human brain which is the largest and most prominent feature in the image. The brain is shown in red and white representing the different areas of the brain that are affected by the salience networks. The top right section shows the greater within-network connectivity between the IBS and HCS which was found for the inferior parietal lobe middle frontal cortex middle singular cortex and superior cerebral cortex. In the center of the image there is a section titled "In the Salience Network of IBS patients greater within network connectivity was observed for the superior temporal cortex rectus gyrus hess gyrus (rectus gryus) hessii gyrus and rectus cyrus) and hessis gyrus. The image also shows the location of the cerebrospinal cord which can be seen in the top right corner of the diagram. The diagram also includes a label that explains the differences between the two types of connections. The text on the right side of the slide provides further information about the differences.

Description Generated using AI

A diagram that shows the different types of salience network connectivity in the brain. It is divided into six sections each representing a different type of brain. The first section on the top left shows the cerebellum of the human brain which is the largest and most prominent feature in the image. The brain is shown in red and white representing the different areas of the brain that are affected by the salience networks. The top right section shows the greater within-network connectivity between the IBS and HCS which was found for the inferior parietal lobe middle frontal cortex middle singular cortex and superior cerebral cortex. In the center of the image there is a section titled "In the Salience Network of IBS patients greater within network connectivity was observed for the superior temporal cortex rectus gyrus hess gyrus (rectus gryus) hessii gyrus and rectus cyrus) and hessis gyrus. The image also shows the location of the cerebrospinal cord which can be seen in the top right corner of the diagram. The diagram also includes a label that explains the differences between the two types of connections. The text on the right side of the slide provides further information about the differences.

We encourage you to view the image in the context of its source document(s) and cite the source(s) when using these images. However, to cite just this image alone, click the “Cite This Image” button and then paste the copied text.

Information copied to your clipboard:

"A diagram that shows the different types of salience network connectivity in the brain. It is divided into six sections each representing a different...