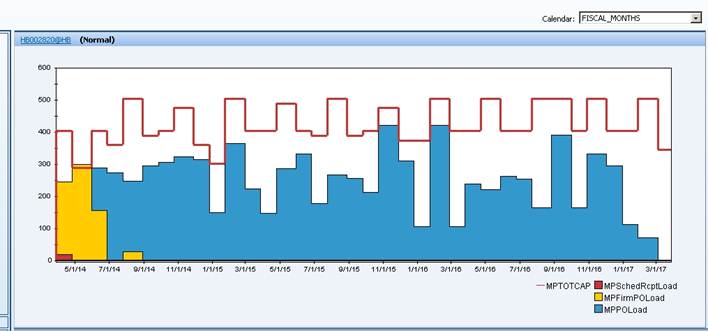
A bar graph showing MPTOTCAP data in 3 different categories (MPSchedRcptLoad MPFirmPOLoad and MPPOLoad) spanning from May 1 2014 to March 1 2017 (in monthly increments). MPSchedRcptLoad varies between 300 and 500 without any notable trends. MPSchedRcptLoad varies between 300 and 0 trending sharply downward from the beginning of May 2014 to the end of June 2014 then staying at zero (barring a small blip in August 2014). MPPOLoad varies between 400 and 0 dropping sharply beginning in January 2017 and landing at zero by the end of February 2017.
Description
Category
-
Date
2014
Collection
We encourage you to view the image in the context of its source document(s) and cite the source(s) when using these images. However, to cite just this image alone, click the “Cite This Image” button and then paste the copied text.


