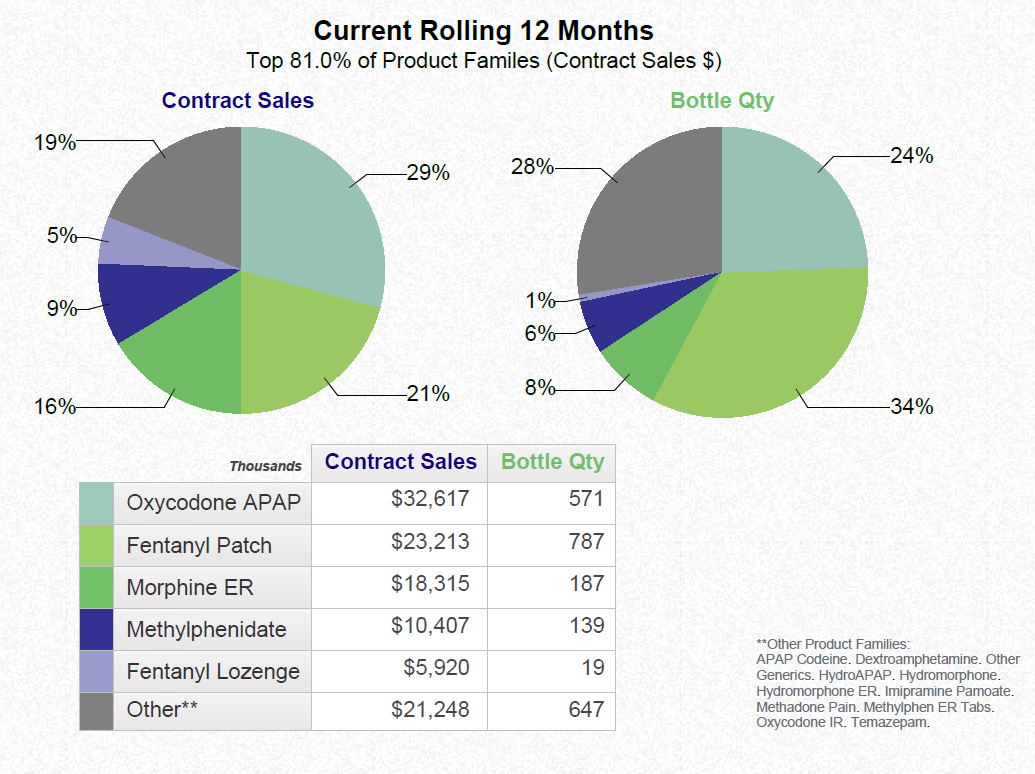
A pie chart that shows the current rolling 12 months of contract sales for product families. The chart is divided into two sections one for contract sales and the other for bottle qty.
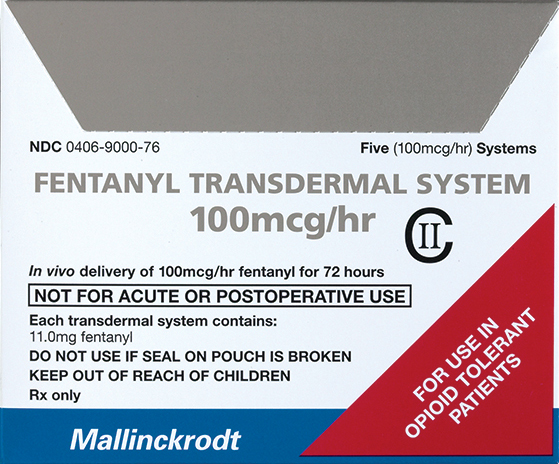
The contract sales section on the left is for Oxycodone APAP which is a type of fentanyl patch. It has a blue and green color scheme while the bottle Qty section has a green and blue color scheme. The contract sales segment on the right is for Bottle Qty which has a gray and blue pie chart. The pie chart shows that the contract sales in contract sales have increased from 19% to 24% in the first half of the year with the highest percentage being in the second half and the lowest percentage being at the third quarter of the fourth quarter.
At the bottom of the chart there is a table that lists the different types of contact sales and their respective percentages. The table also includes a list of other contact sales such as fentanyl patches fentanyl lozenges and fentanyl patches. The text on the chart reads "Current Rolling 12 Months" and "Top 81.0% of Product Families (Contract Sales $)".
Category
Source 1 of 4
-
Date
2015
Collection
-
Date
2015
Collection
-
Date
2012
Collection
-
Date
2015
Collection
We encourage you to view the image in the context of its source document(s) and cite the source(s) when using these images. However, to cite just this image alone, click the “Cite This Image” button and then paste the copied text.
