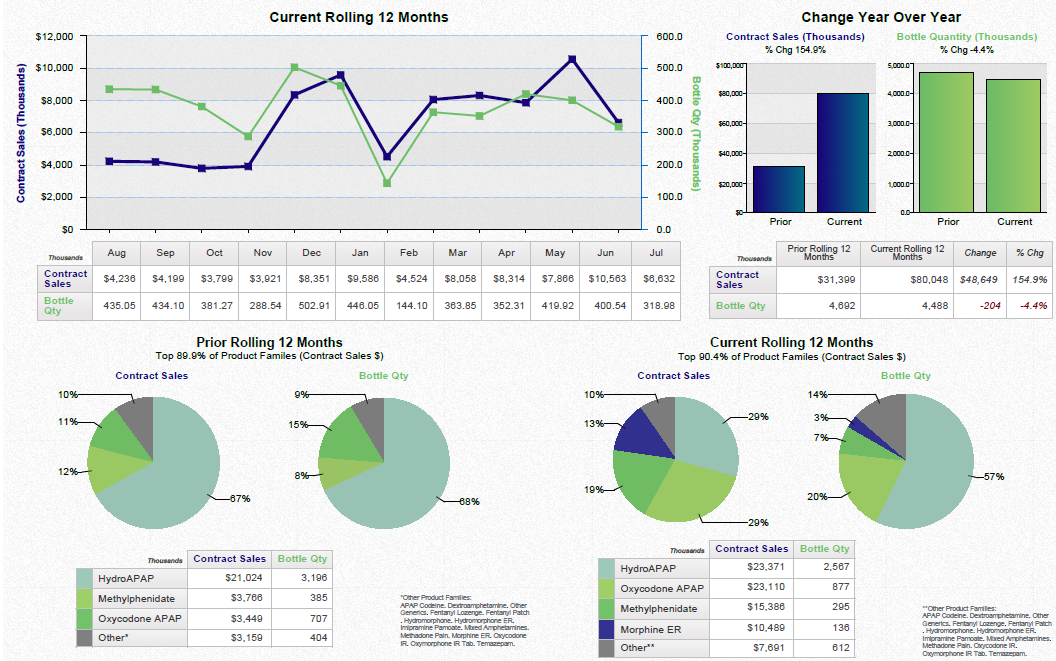
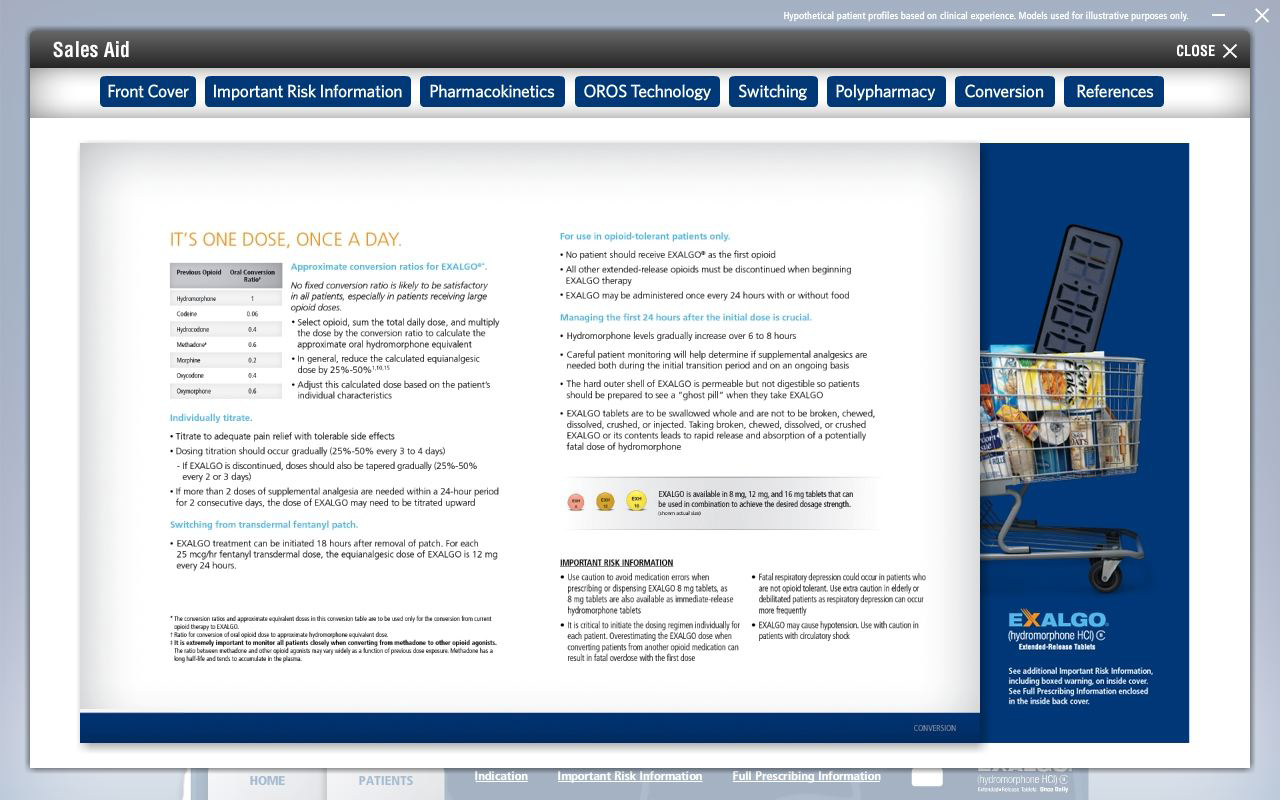
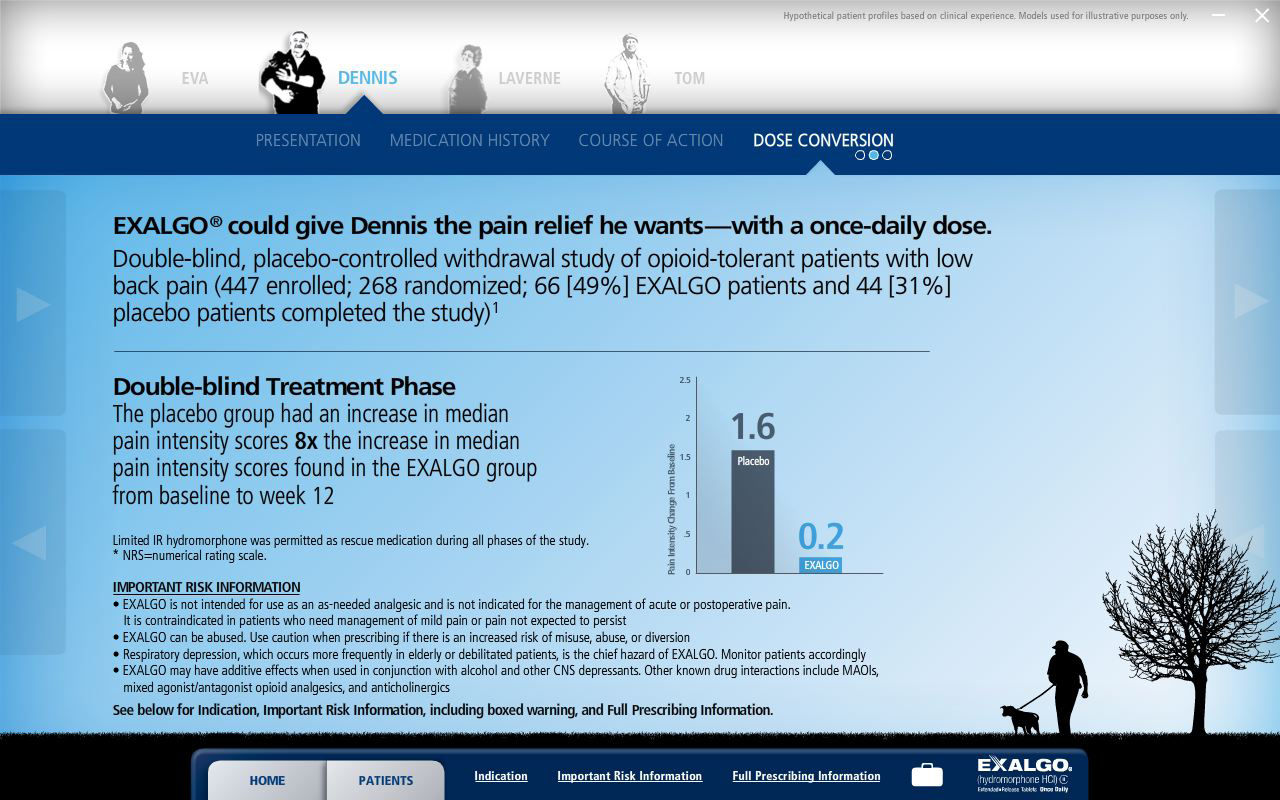
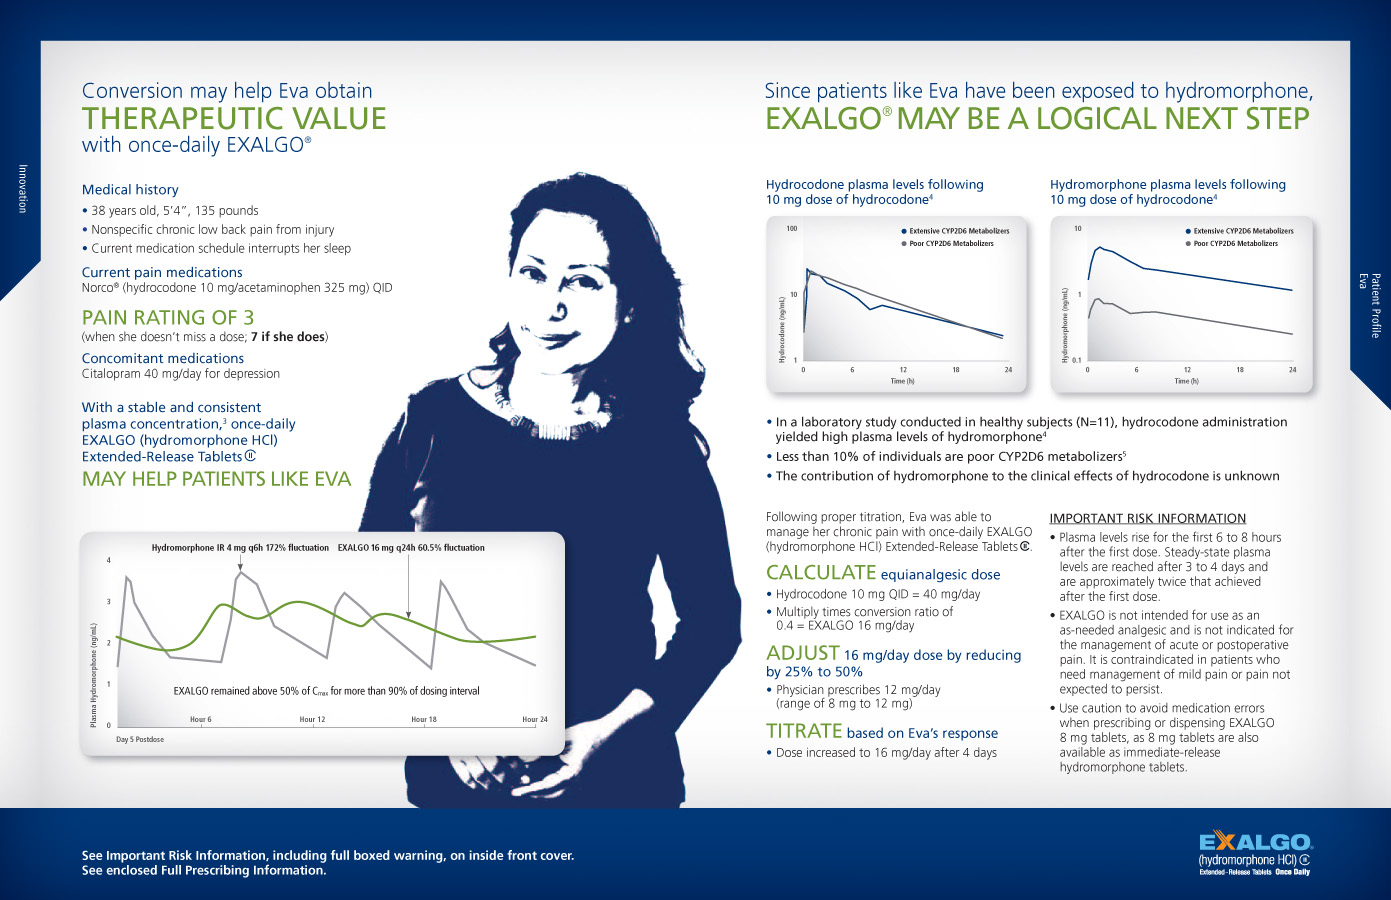
An infographic that explains the concept of Therapeutic Value. It has a blue background with white text. On the left side of the image there is a photo of a woman with long dark hair and a smile on her face. She is wearing a black top and is standing in front of a white background.
On the right side there are three graphs and text that explain the concept. The first graph is a line graph that shows the pain rating of a patient the second is a curve graph and the third is a graph that represents the percentage of patients who have been diagnosed with hypothyroidism. The text on the image explains that the treatment may be a logical next step as indicated by the text "Exalgo" at the bottom right corner. The infographic also includes information about the treatment such as the patient's name the treatment name and a brief description of the treatment.
Type
Category
Source 1 of 2
-
Date
2012
Collection
-
Date
2012
Collection
We encourage you to view the image in the context of its source document(s) and cite the source(s) when using these images. However, to cite just this image alone, click the “Cite This Image” button and then paste the copied text.


