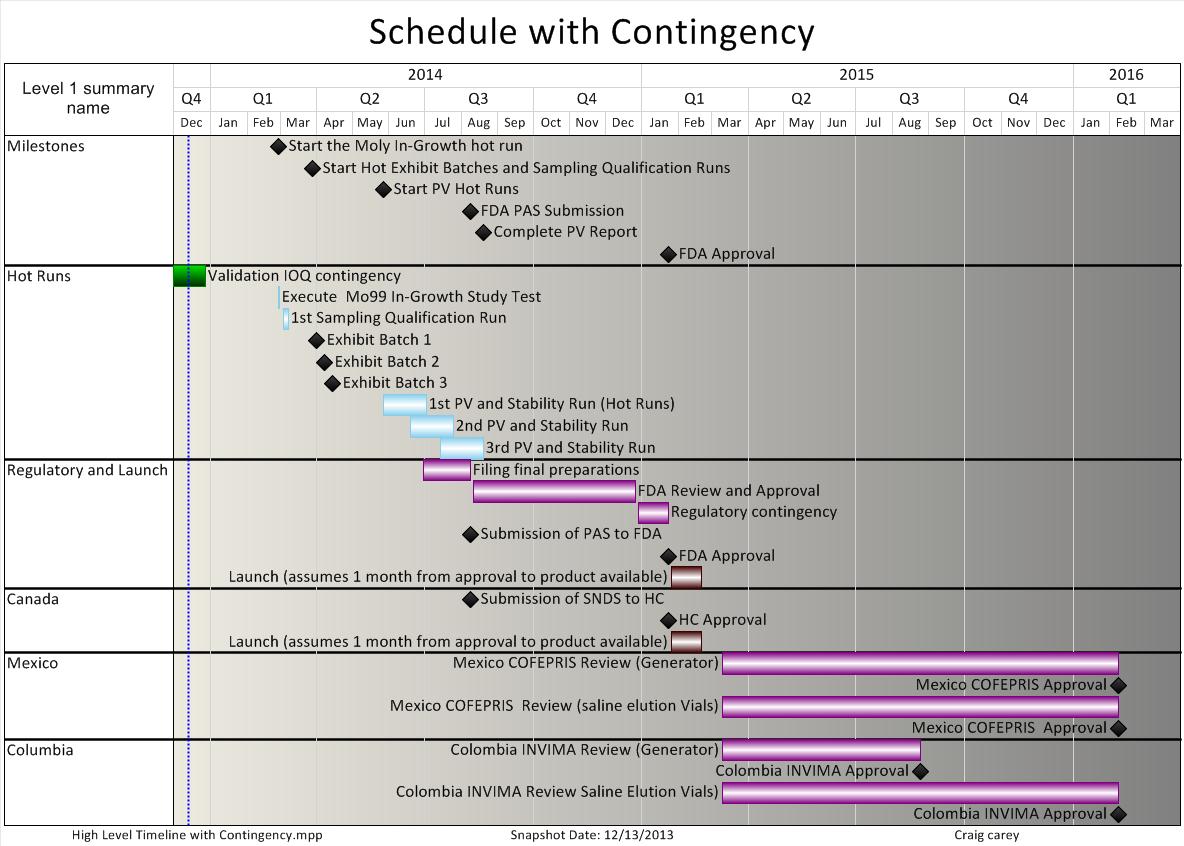
A data visualization with the title "Schedule with Contingency" (at the top) and the filename "High Level Timeline with Contingency.mpp" (at the bottom). It was created by Craig Carey on December 13 2013.
The x-axis represents time spanning from December 2013 to March 2016 in monthly increments. The y-axis lists "Milestones" "Hot Runs" "Regulatory and Launch" "Canada" "Mexico" and "Columbia". Each row contains multiple values variously represented as bullet points (for a single date) or horizontal bars (for a range of dates). There is overlap on the timing of each row but things at the top generally begin and end sooner than things that are "below" them visually.
The background is white and grey with graphic elements in black green blue purple and brown and text in black.
Type
Category
Source 1 of 2
-
Date
2013
Collection
-
Date
2013
Collection
We encourage you to view the image in the context of its source document(s) and cite the source(s) when using these images. However, to cite just this image alone, click the “Cite This Image” button and then paste the copied text.


