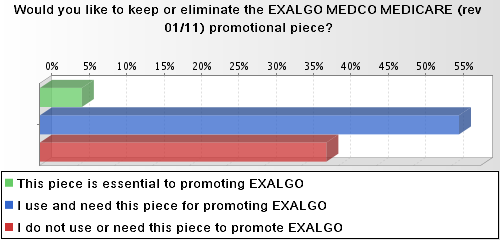
A bar graph that shows the percentage of people who would like to keep or eliminate the EXALGO MEDICO Medicare (Rev. 01/11) promotional piece. The x-axis of the graph is divided into four sections each representing a different percentage.
The first section representing the percentage is green the second section is blue the third section is red and the fourth section is orange. The fifth section is purple the sixth section is pink the seventh section is green and the eighth section is yellow the ninth section is gray the tenth section is brown the eleventh section is white the twelfth section is black the thirteenth section is light blue and all the other three sections are colored in shades of blue green and red.
At the bottom of the image there is a text that reads "This piece is essential to promoting EXALGGO. I use and need this piece for promoting EALGO." This text is likely referring to the use of the promotional piece and the need to do not use it.
Category
Source 1 of 2
-
Date
2011
Collection
-
Date
2011
Collection
We encourage you to view the image in the context of its source document(s) and cite the source(s) when using these images. However, to cite just this image alone, click the “Cite This Image” button and then paste the copied text.






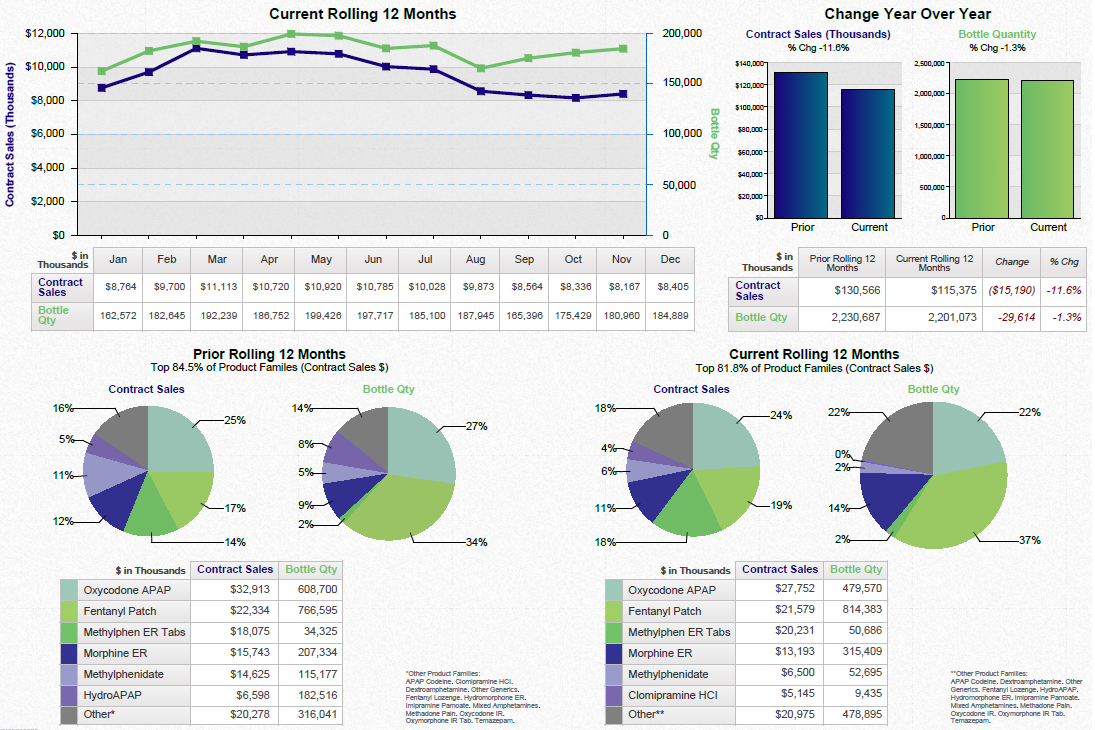

![This is a pie chart showing the top 10 opioids by total prescriptions. The 10 drugs ordered from highest market share to lower market share are : OxyContin (new formulation) Fentanyl patch Long-acting morphine Opana ER Kadian Avinza Butrans OxyContin [previous formulation?] Long-acting oxycodone and Duragesic. The top 3 opioids account for 84.84% of the market share and are tightly clustered (between 27.46% and 29.07% each).](https://oidaresourcesimages-cdn-endpoint-duhwc2gse6gdbng7.a01.azurefd.net/public/full/afbedd91-ff90-4fa3-a3a4-88a63d56c0b2.png)


