


Title
Brain heatmaps and bar graphs
Description
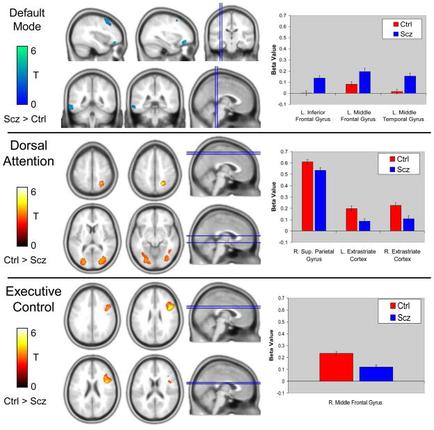
This is a data visualization consisting of 18 heatmaps of the brain & 3 interpretative bar charts. The heatmaps compare Scz and Ctrl for Default Mode Dorsal Attention and Executive Control. The bar charts compare Ctrl (in red) and Scz (in blue) for different regions of the brain (ex : left inferior frontal gyrus) each measuring Beta Value on the y-axis (on a scale from -0.1 to 0.7).
Type 
Category
-
Date
2015
Collection
We encourage you to view the image in the context of its source document(s) and cite the source(s) when using these images. However, to cite just this image alone, click the “Cite This Image” button and then paste the copied text.