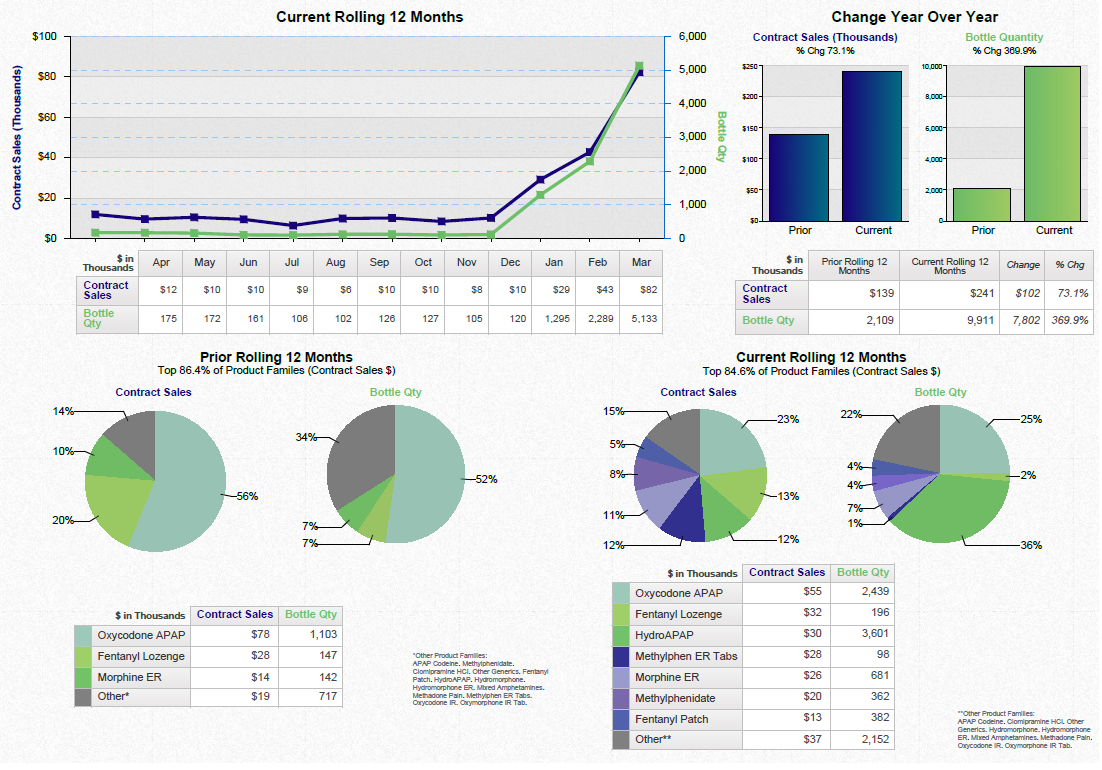
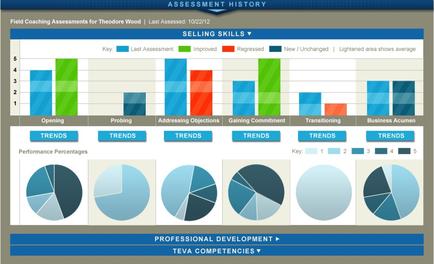
A screenshot of the Field Coaching Assessments for Theodore Wood Assessment History page. It is a dashboard that shows the sales skills of a company. The page has a blue header with the title "Selling Skills" at the top. Below the header there is a table with three columns - Key Last Assessment Improved Regressed and New/Unchanged. The first column is labeled "Opening" the second column is titled "Probing" and the third column is labelled "Addressing Objections". The fourth column has a bar graph that shows that the company has achieved a significant increase in sales skills. The fifth column has two pie charts one showing the performance percentages of the company and the other showing the trends. At the bottom of the page there are three smaller pie charts - Professional Development tea Competencies and Business Acumen. The pie charts are arranged in a grid-like pattern with each pie chart representing a different aspect of the sales process. The first pie chart shows the company's performance percentage the second pie chart displays the number of sales skills the third pie chart has the percentage of sales the fourth pie chart showing the percentage and the fifth pie chart indicates the percentage.

-
Date
2013
Collection
We encourage you to view the image in the context of its source document(s) and cite the source(s) when using these images. However, to cite just this image alone, click the “Cite This Image” button and then paste the copied text.