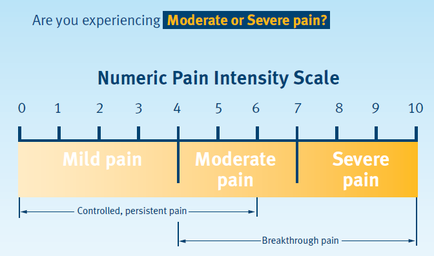
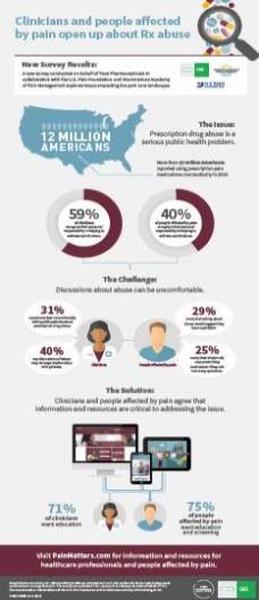
An idiographic that explains the impact of pain on people affected by pain open up about Rx abuse. It has a blue background with a map of the United States in the top left corner. The map is divided into different sections each representing a different statistic. The top section of the idiographic has a title that reads "12 Million Americans" in bold white letters. Below the title there is a section titled "Clinicians and people affected" in smaller white letters with a magnifying glass icon in the center. There are also several smaller sections in the idiographic including a pie chart that shows the percentage of people who have been diagnosed with pain a list of symptoms and a survey result. The pie chart shows that 59% of people in the US have experienced pain while 40% have experienced a decrease in pain. The chart also includes a brief description of the statistics which states that the number of patients affected by the pain has increased by 29%. At the bottom of the image there are several icons that represent different aspects of pain management such as a computer monitor a tablet and an alarm clock. The idiographic also has a link to a website that provides more information about the topic.
Description 
Type
Category
Source 1 of 2
-
Date
2016
Collection
-
Date
2016
Collection
We encourage you to view the image in the context of its source document(s) and cite the source(s) when using these images. However, to cite just this image alone, click the “Cite This Image” button and then paste the copied text.