


Title
Description
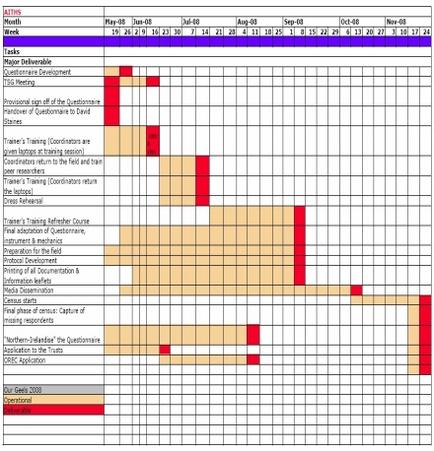
This is an untitled Gantt chart. Tasks (a.k.a. Major Deliverables) are listed in the first column with color-coded cells tracking progress proceeding from left (beginning with May 19 2008) to right (ending with November 24 2008). Orange cells denote Operational status and Red cells mark the completion of a task.
Type 
Category
Source 1 of 4
-
Date
2014
Collection
-
Date
2014
Collection
-
Date
2015
Collection
-
Date
2014
Collection
We encourage you to view the image in the context of its source document(s) and cite the source(s) when using these images. However, to cite just this image alone, click the “Cite This Image” button and then paste the copied text.


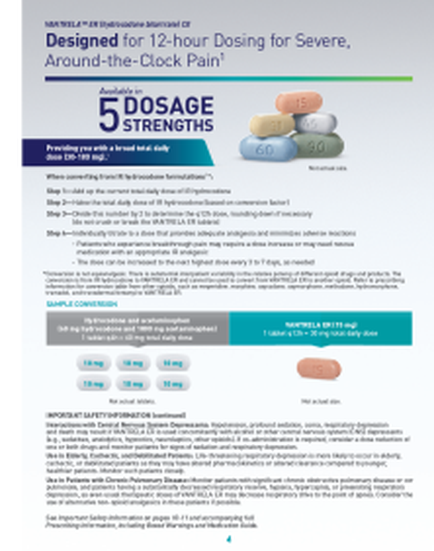
![An advertisement for Nucynta ER with sections for "Discontinuation Rates Due to Adverse Events" and "Incidence of Opioid Withdrawal Symptoms". There is also a bar graph with the title "Incidence of treatment-emergent adverse events leading to discontinuation reported by [greater than or equal-to] 2% of patients". The background is white and red with text in red black and white.<br /><br />On the right side there is "Selected Important Safety Information". The logo of logo of Nucynta ER is at the bottom.](https://oida-resources-images.azureedge.net/public/full/38ba2066-6f55-47b4-9093-78b9be045673.jpg)