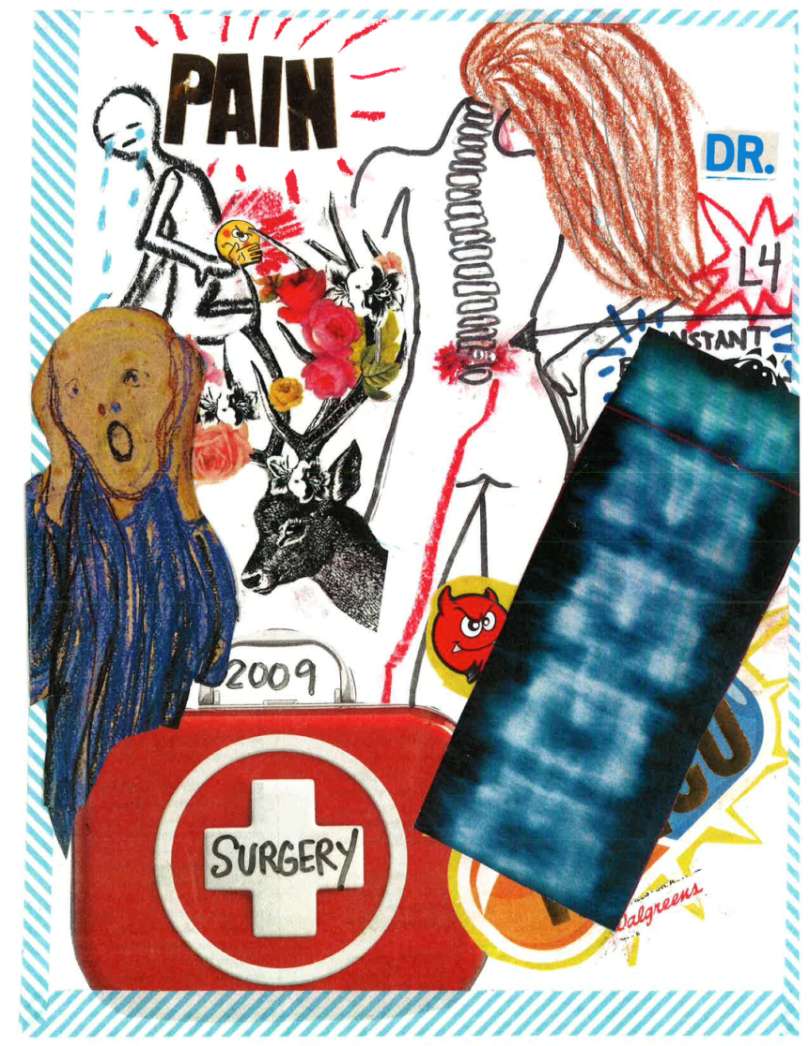
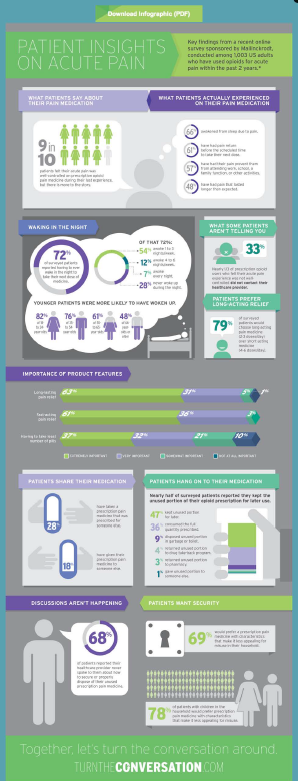
An infographic titled "Patient Insights on Acute Pain". It is divided into three sections.
The first section is titled "9 in 10" and has a blue background. It has a white circle in the center with a green arrow pointing to it. Inside the circle there are several icons representing different aspects of patient insights. The icons include a person with a speech bubble a person in a hospital bed and a person holding a clipboard.
Next to the first section there is a pie chart that shows the percentage of patients who have been diagnosed with acute pain. The pie chart shows that the majority of patients have experienced acute pain while the majority have experienced a decrease in the number of patients. The chart also has a bar graph that shows that 69% of patients are diagnosed with the condition.
- Together let's turn the conversation around. The infographic is designed to provide information about patient insights and how they can help people understand the condition and how it affects their health.
Type
Category
Source 1 of 3
-
Date
2015
Collection
-
Date
2015
Collection
-
Date
2015
Collection
We encourage you to view the image in the context of its source document(s) and cite the source(s) when using these images. However, to cite just this image alone, click the “Cite This Image” button and then paste the copied text.

