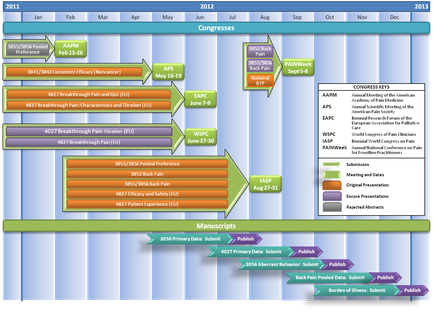
A timeline chart that shows the timeline of the United States Congress from 2011 to 2013. The chart is divided into different sections each representing a different year. The first section is titled "2011" and shows the dates and times of the Congress. The dates are arranged in a grid-like format with each section having a different color and label. The first section has a title that reads "Congresses" and a brief description of the event. The second section has an arrow pointing to the top of the chart indicating the direction of the flow of information. The third section has the date and time as well as a description of each event. There are also several labels on the chart that provide further details about the event such as the date time and location. The labels also mention that the event is scheduled for the month of January February March April May June July August and September. The fourth section has information about the events including the names of the attendees the date of the meeting and the location of the conference. The fifth section has links to different sections of the timeline including "Manuscripts" "Publish" and "Publishing". Overall the chart is a visual representation of the current and upcoming events in the US Congress.

Category
-
Date
2012
Collection
We encourage you to view the image in the context of its source document(s) and cite the source(s) when using these images. However, to cite just this image alone, click the “Cite This Image” button and then paste the copied text.