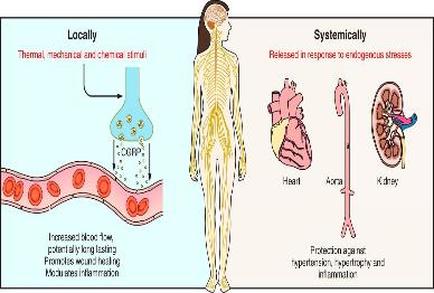
A diagram that shows the process of systematically releasing a response to endocrine stress. On the left side of the image there is a cross-section of a human body showing the internal structure of the human body. On the right side there are three illustrations that show the different stages of the process. The first illustration shows a thermometer which is a device used to measure the temperature and pressure of a person's blood pressure. The thermometer is located in the center of the body and is used to regulate the temperature of the blood pressure in the body. The second illustration shows the internal organs of the heart including the heart and the kidney. The heart is shown in the top right corner with the kidney on the top left corner and the kidneys on the bottom right corner. The kidneys are shown on the left and right sides of the diagram. The diagram also shows the location of the thermometer and the pressure on the heart. The image is labeled with the words "Locally" and "Systemically" at the top indicating that the image is meant to illustrate the process in which the person is releasing the response to the endocrine system.
Description 
Type
Category
Source 1 of 2
-
Date
2018
Collection
-
Date
2018
Collection
We encourage you to view the image in the context of its source document(s) and cite the source(s) when using these images. However, to cite just this image alone, click the “Cite This Image” button and then paste the copied text.