


Title
Description 
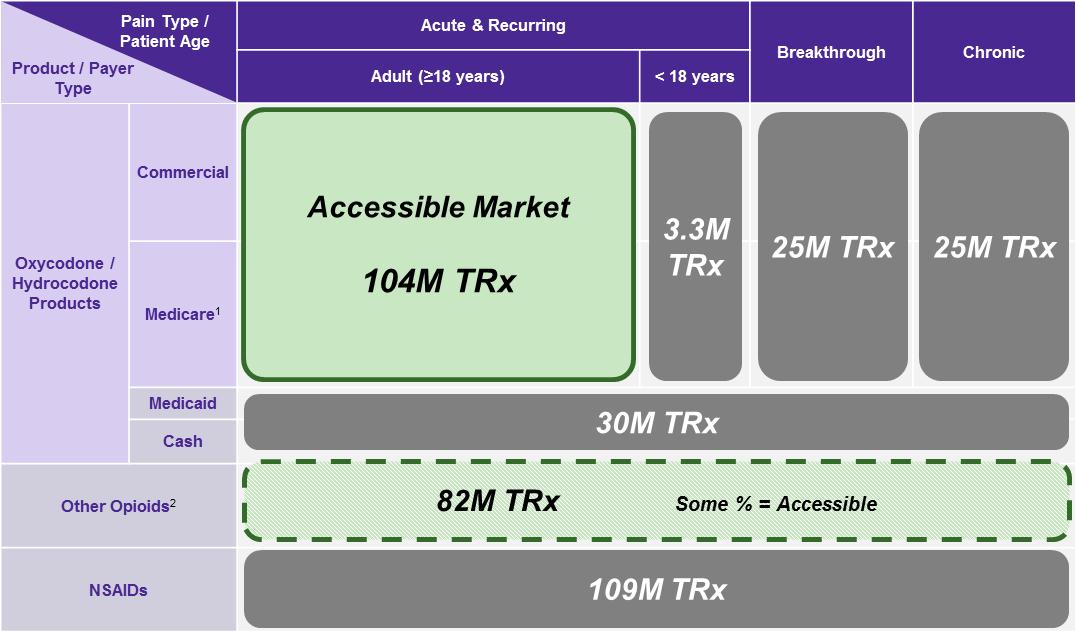
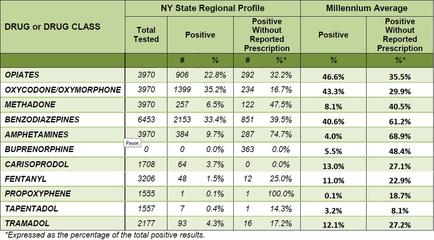
A table that shows the percentage of the total positive results of the NY State Regional Profile of a drug or drug class in the United States. The table is divided into two columns one for the drug class and the other for the Millennium Average. The table shows the total number of positive and negative results for each drug class with the highest percentage being "Total Tested" and the lowest being "Positive Without Reported Prescription". The table also shows that the percentage is "Millennium Average" and that the maximum number is "positive without reported prescription". There are three columns in the table each representing a different drug class - Opiates Oxycodone/Oxymorphone Methadone Benzodiazepines Amphetamine Buprenorphine Carisopropidol Fentanyl Propoxyphenone and Tapentadol. The highest percentage is the percentage with a percentage of positive results while the lowest percentage is not. The percentages range from 0.5% to 1.2%. Overall the table provides a comprehensive overview of the drug and drug class results in the state's regional profile showing that the majority of the results are positive without reported prescriptions.
Type
Category
-
Date
2013
Collection
We encourage you to view the image in the context of its source document(s) and cite the source(s) when using these images. However, to cite just this image alone, click the “Cite This Image” button and then paste the copied text.